
P-Value Pitfalls
Megan Ayers
Math 141 | Spring 2026
Friday, Week 8
Let’s Talk About P-values
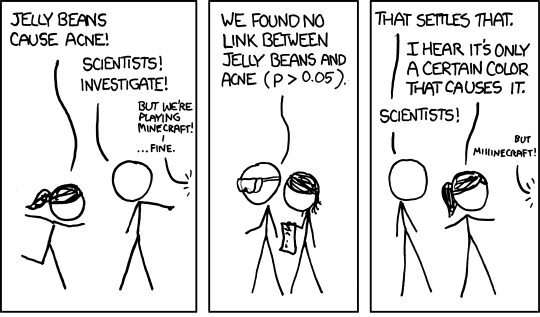
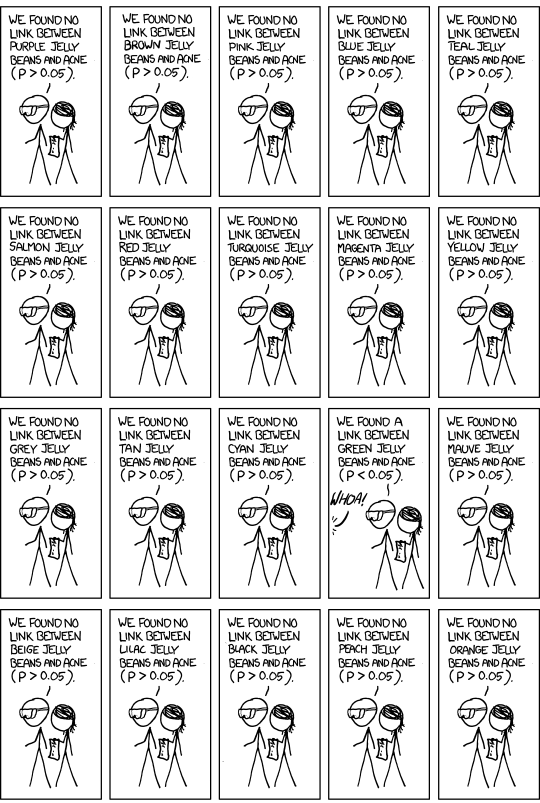
A consequence: P-hacking: Cherry-picking promising findings that are beyond this arbitrary threshold.
Let’s Talk About P-values
A consequence: P-hacking: Cherry-picking promising findings that are beyond this arbitrary threshold.
Let’s Talk About P-values
A consequence: P-hacking: Cherry-picking promising findings that are beyond this arbitrary threshold.

- Q: If we run 100 hypothesis tests where all null hypotheses are true, how many do we expect to have a P-value less than 0.05 due to chance?
- This is also known as the multiple comparisons problem
Let’s Talk About P-values
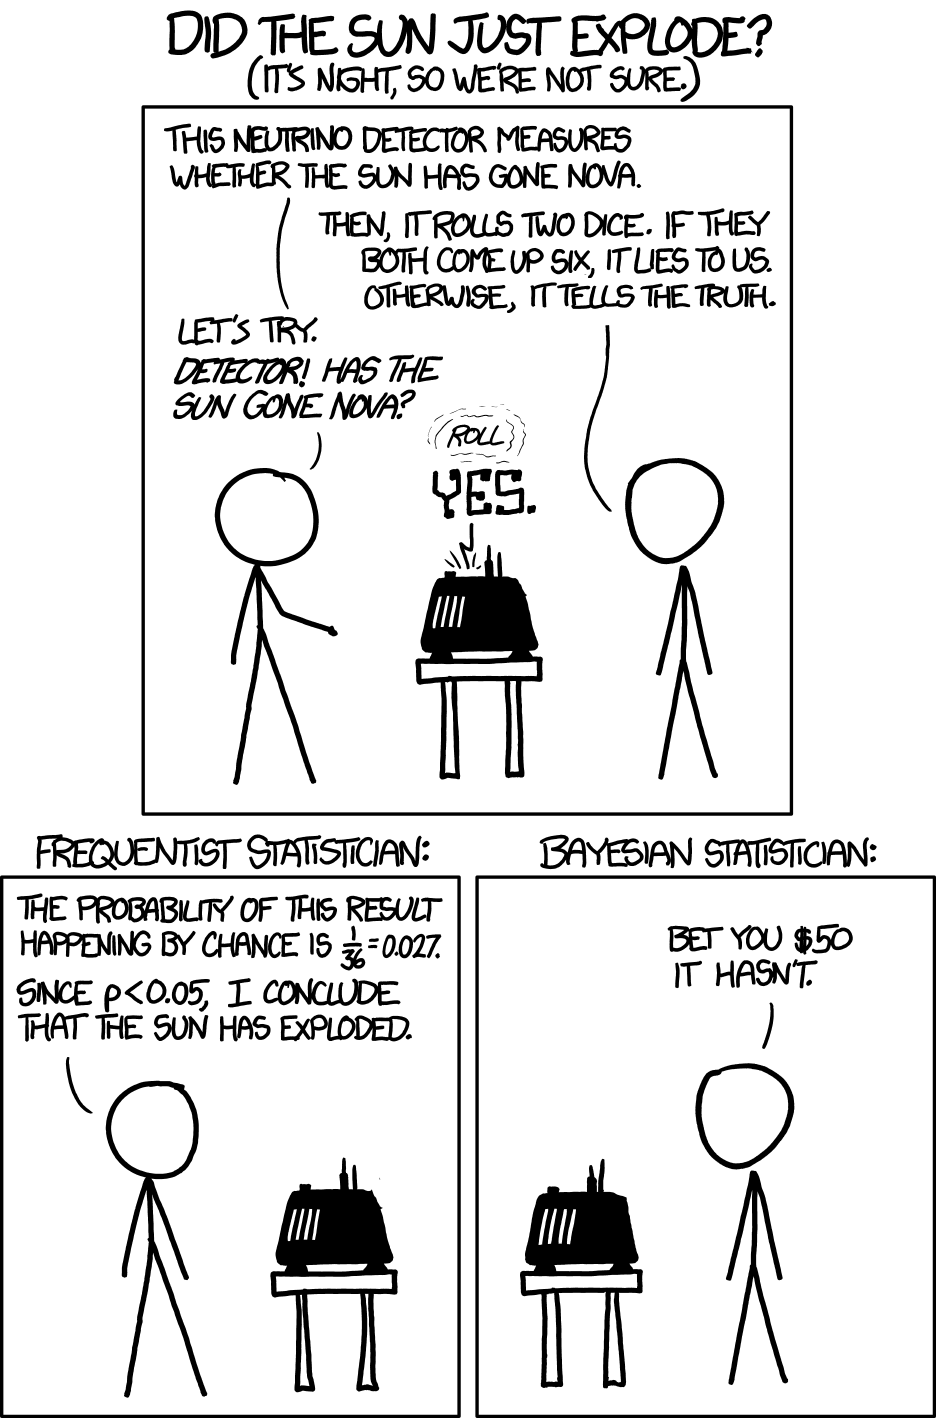
Despite its issues, p-values are still quite popular and can still be a useful tool when used properly.
In 2014, George Cobb a professor from Mount Holyoke College posed the following questions (and answers):
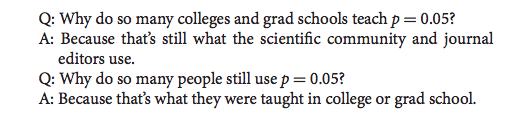
- We can break the cycle!
Inference: The Big Picture
These two approaches are two sides of the same coin!
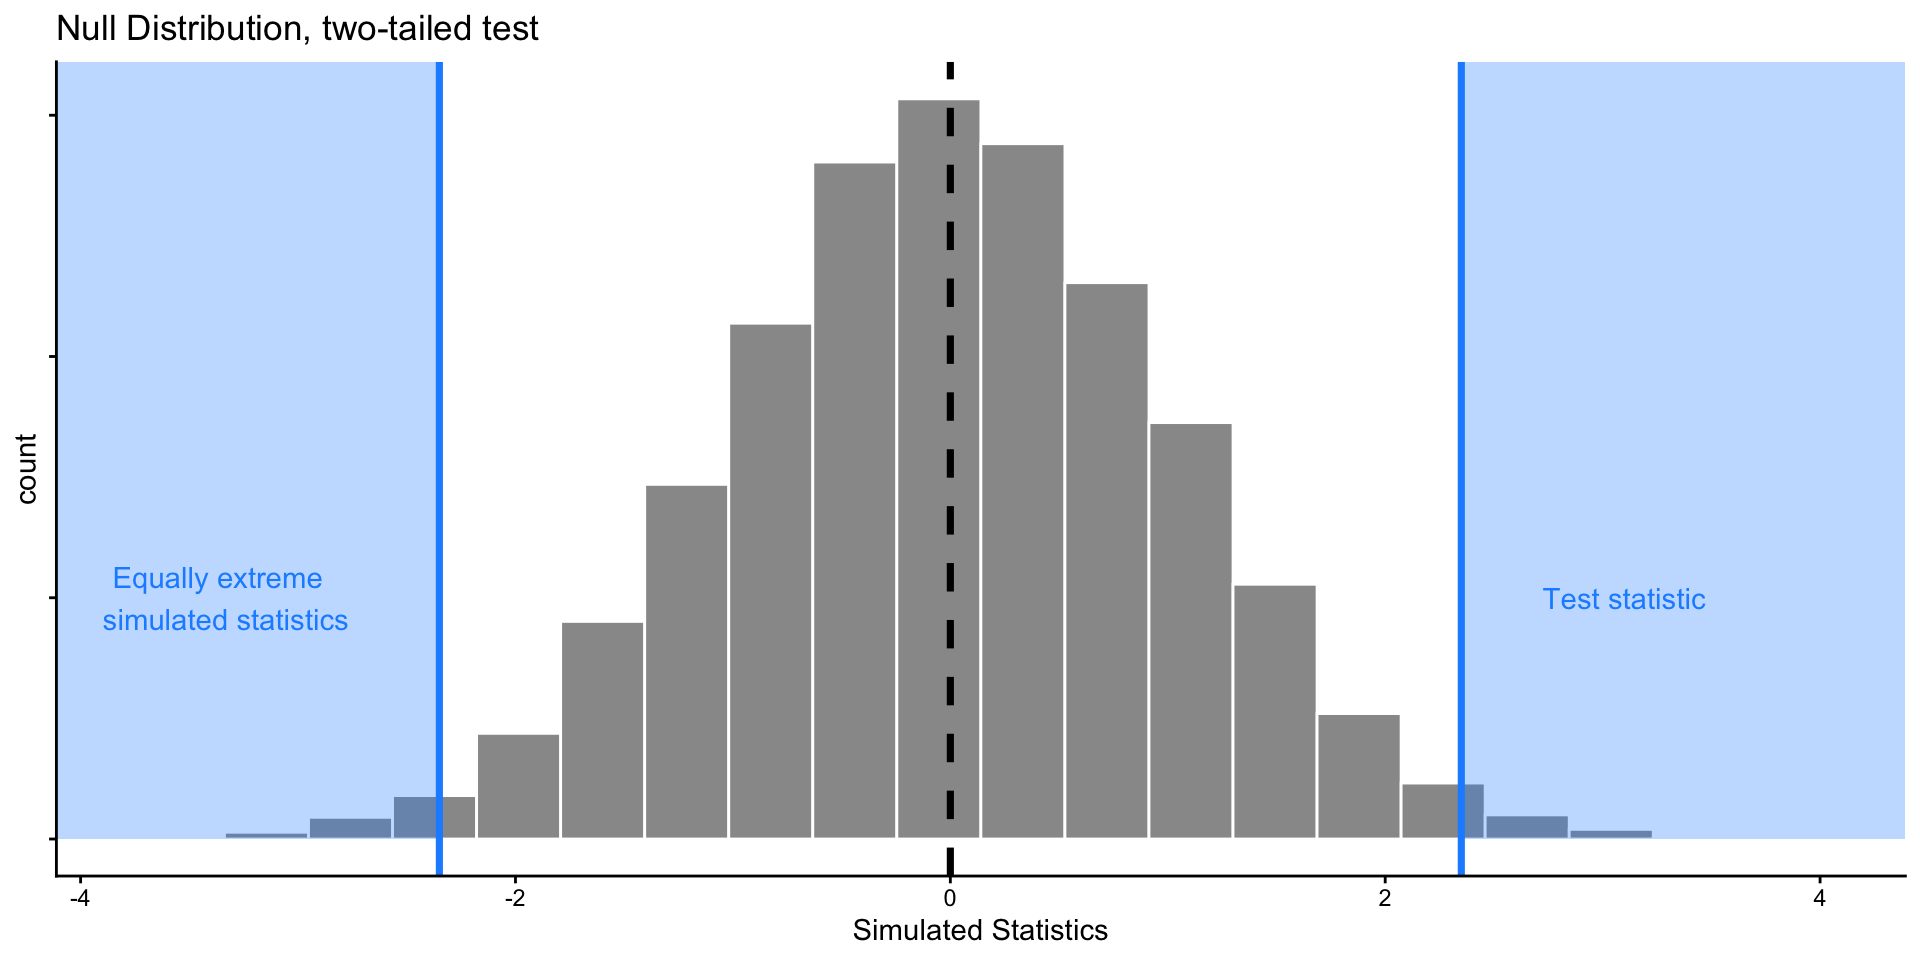
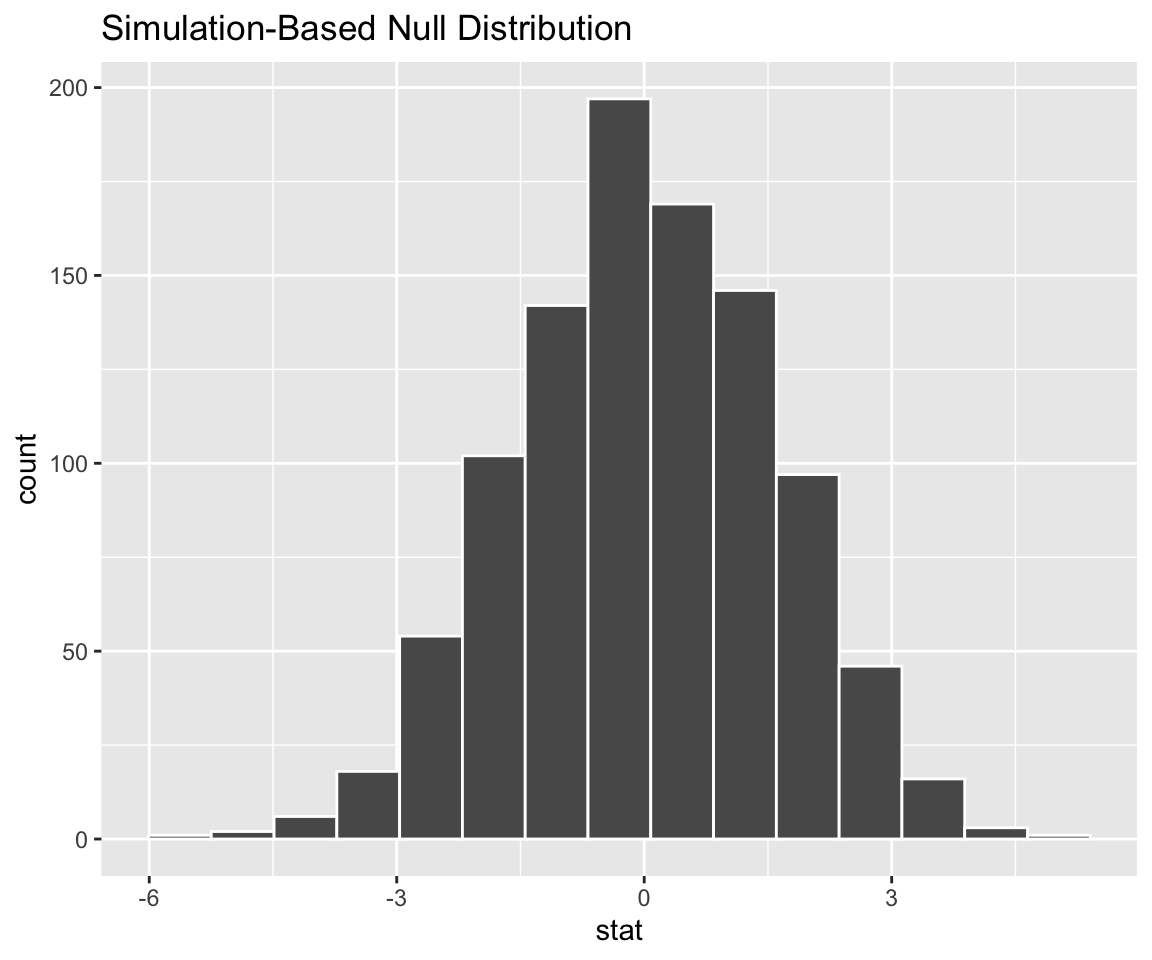
Suppose we have \(H_0: \mu = 0\), and observe a test statistic
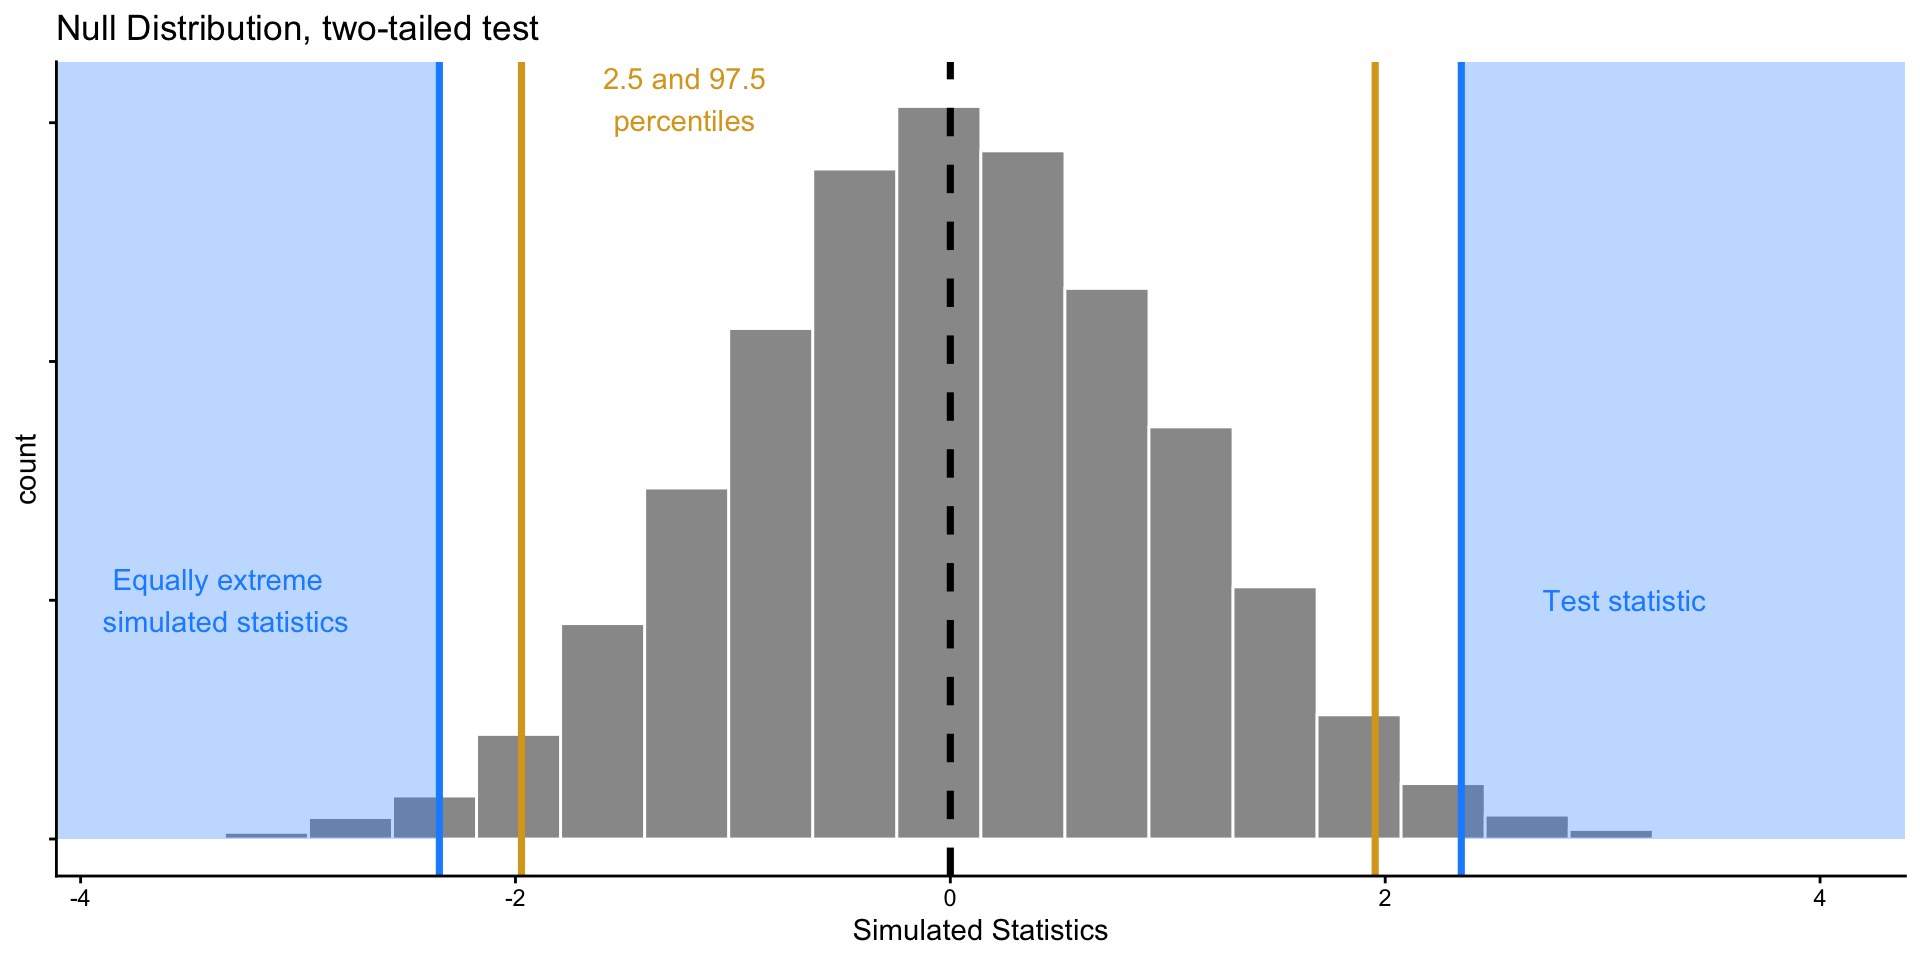
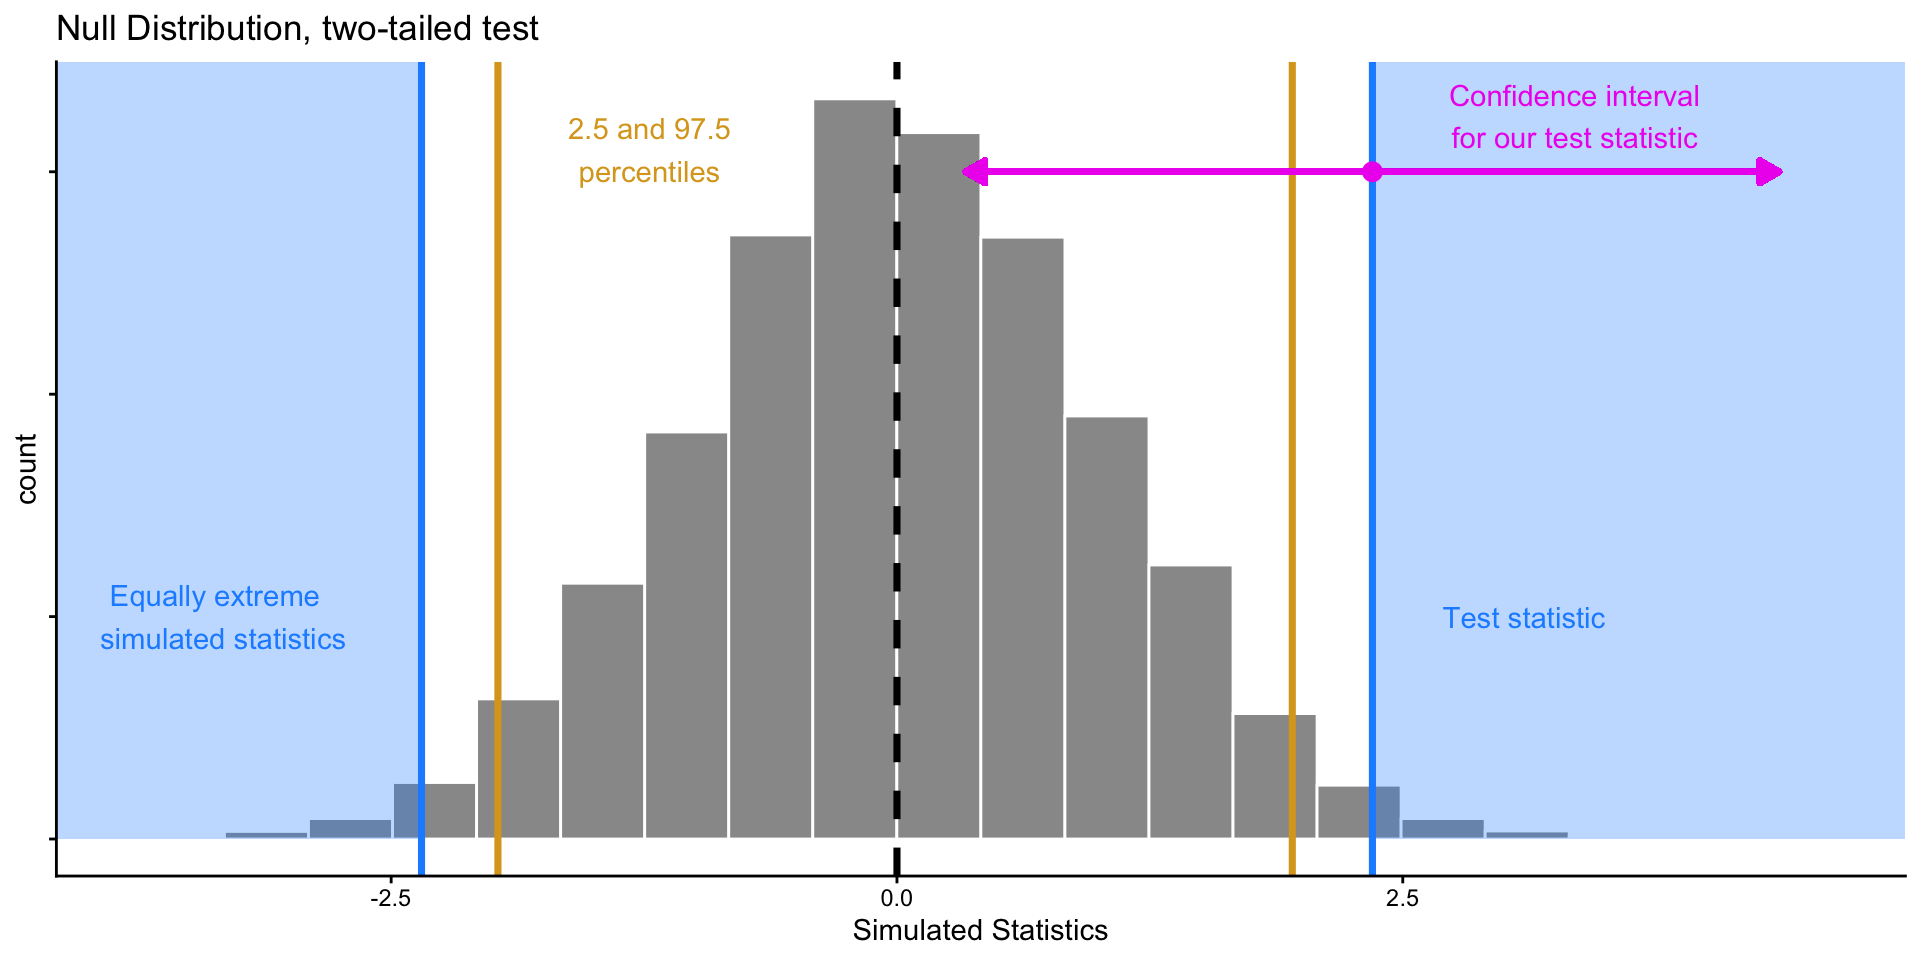
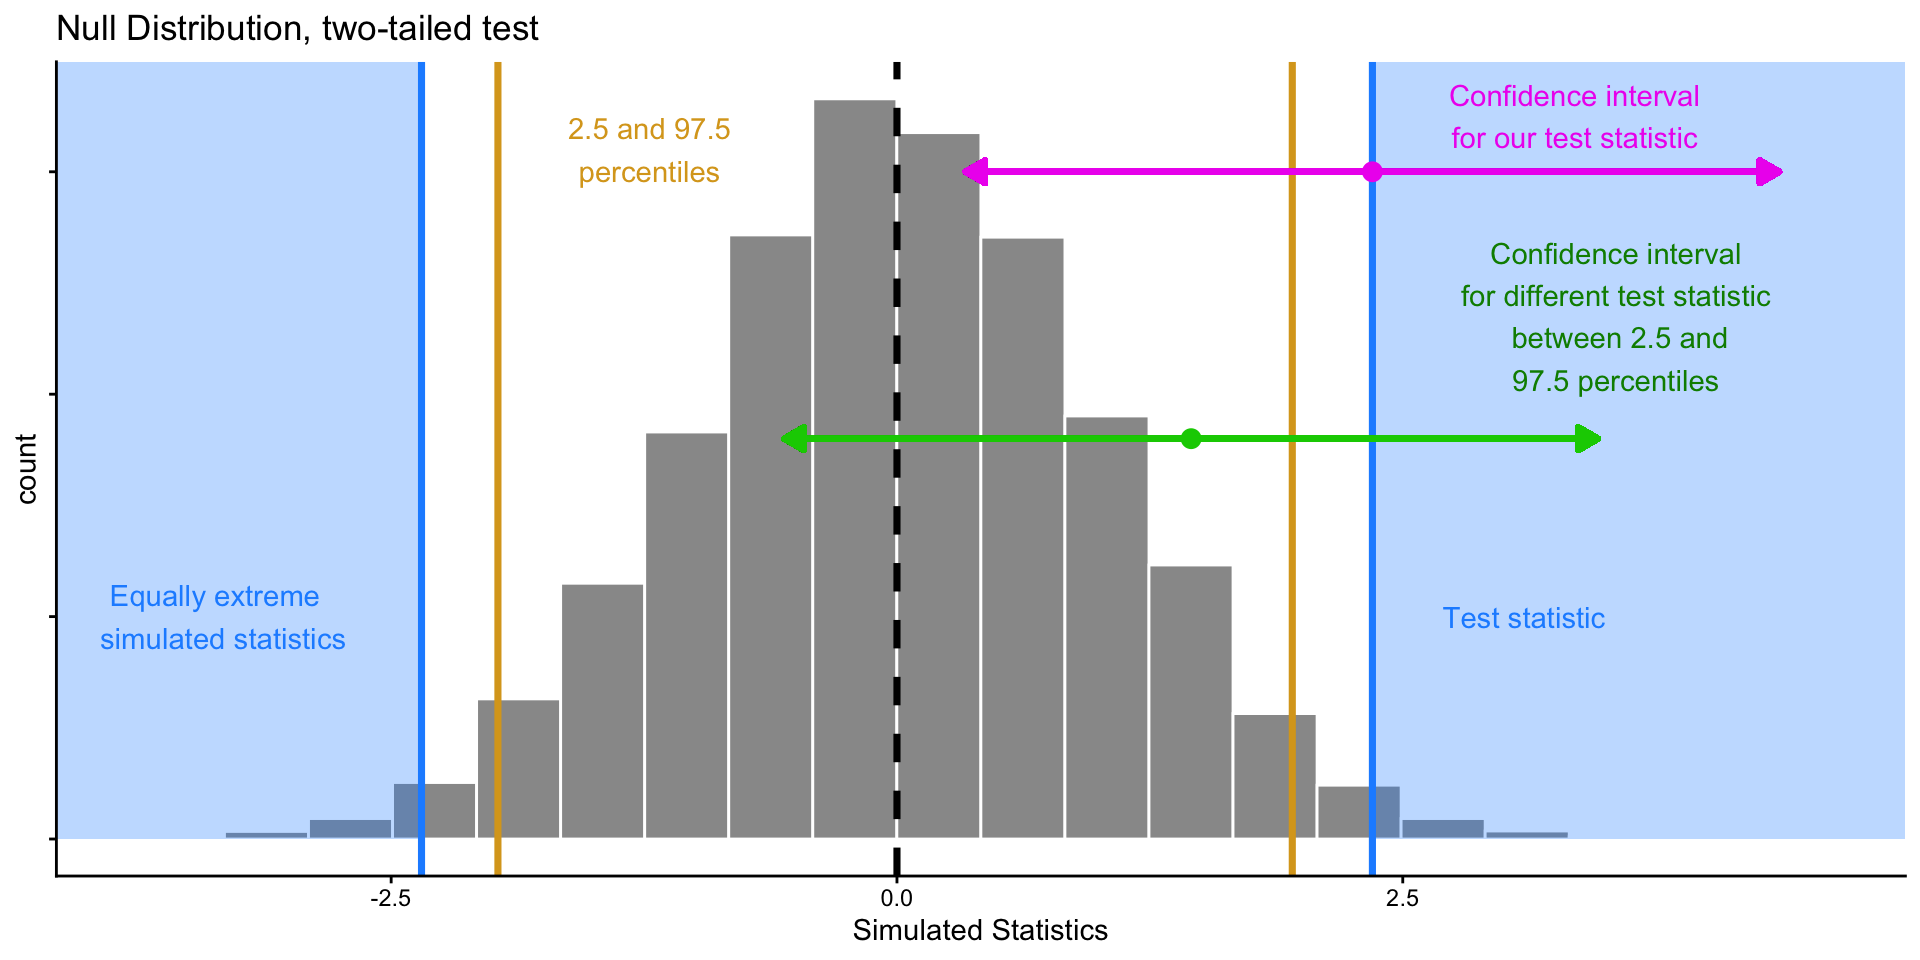
Performing 2-sided hypothesis test with \(\alpha = 0.05\) is equivalent to computing a 95% confidence interval (CI) from our data and seeing if 0 falls inside it.
- For any value \(x_{in}\) in CI, we would not reject a null hypothesis \(H_0: \mu = x_{in}\) given our data.
- For any value \(x_{out}\) outside of CI, we would reject a null hypothesis \(H_0: \mu = x_{out}\).
Inference: The Big Picture
These two approaches are two sides of the same coin!
Suppose we have \(H_0: \mu = 0\), and observe a test statistic
Performing 2-sided hypothesis test with \(\alpha = 0.05\) is equivalent to computing a 95% confidence interval (CI) from our data and seeing if 0 falls inside it.
- For any value \(x_{in}\) in CI, we would not reject a null hypothesis \(H_0: \mu = x_{in}\) given our data.
- For any value \(x_{out}\) outside of CI, we would reject a null hypothesis \(H_0: \mu = x_{out}\).
Statistical Inference Zoom Out – Estimation
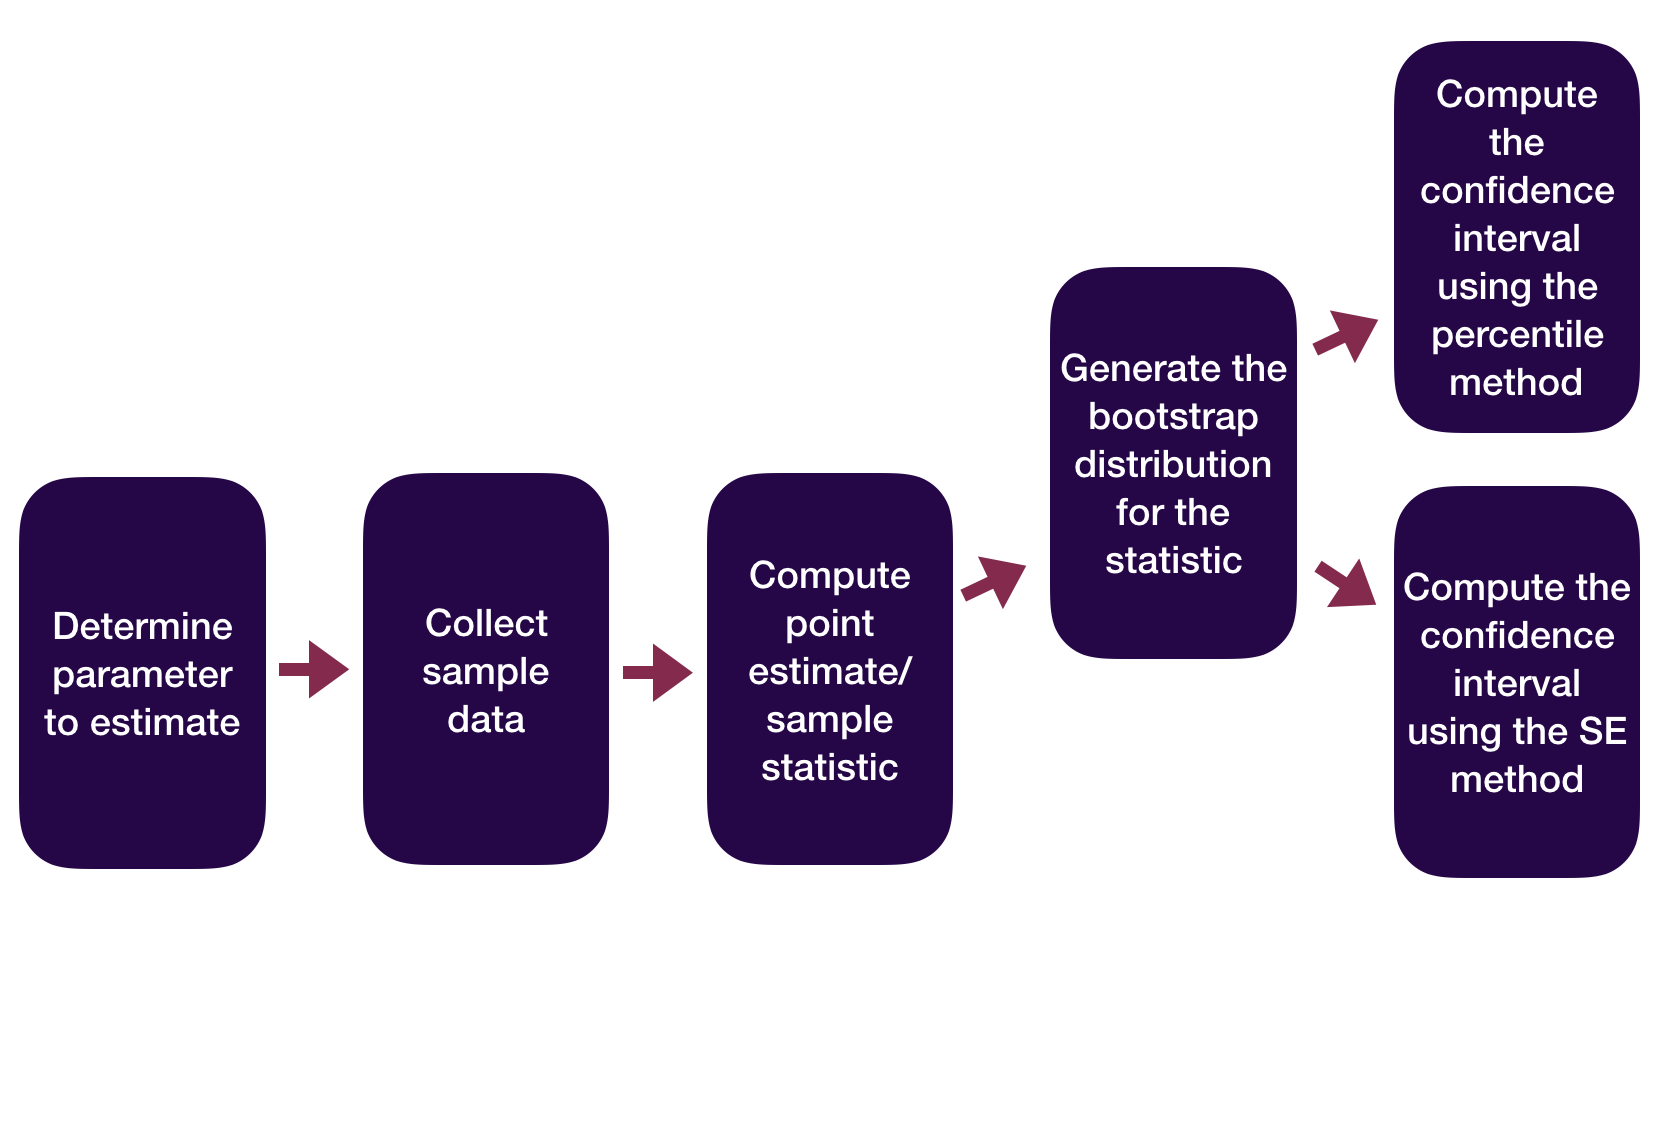
Question: How did folks do inference before computers?
Statistical Inference Zoom Out – Estimation
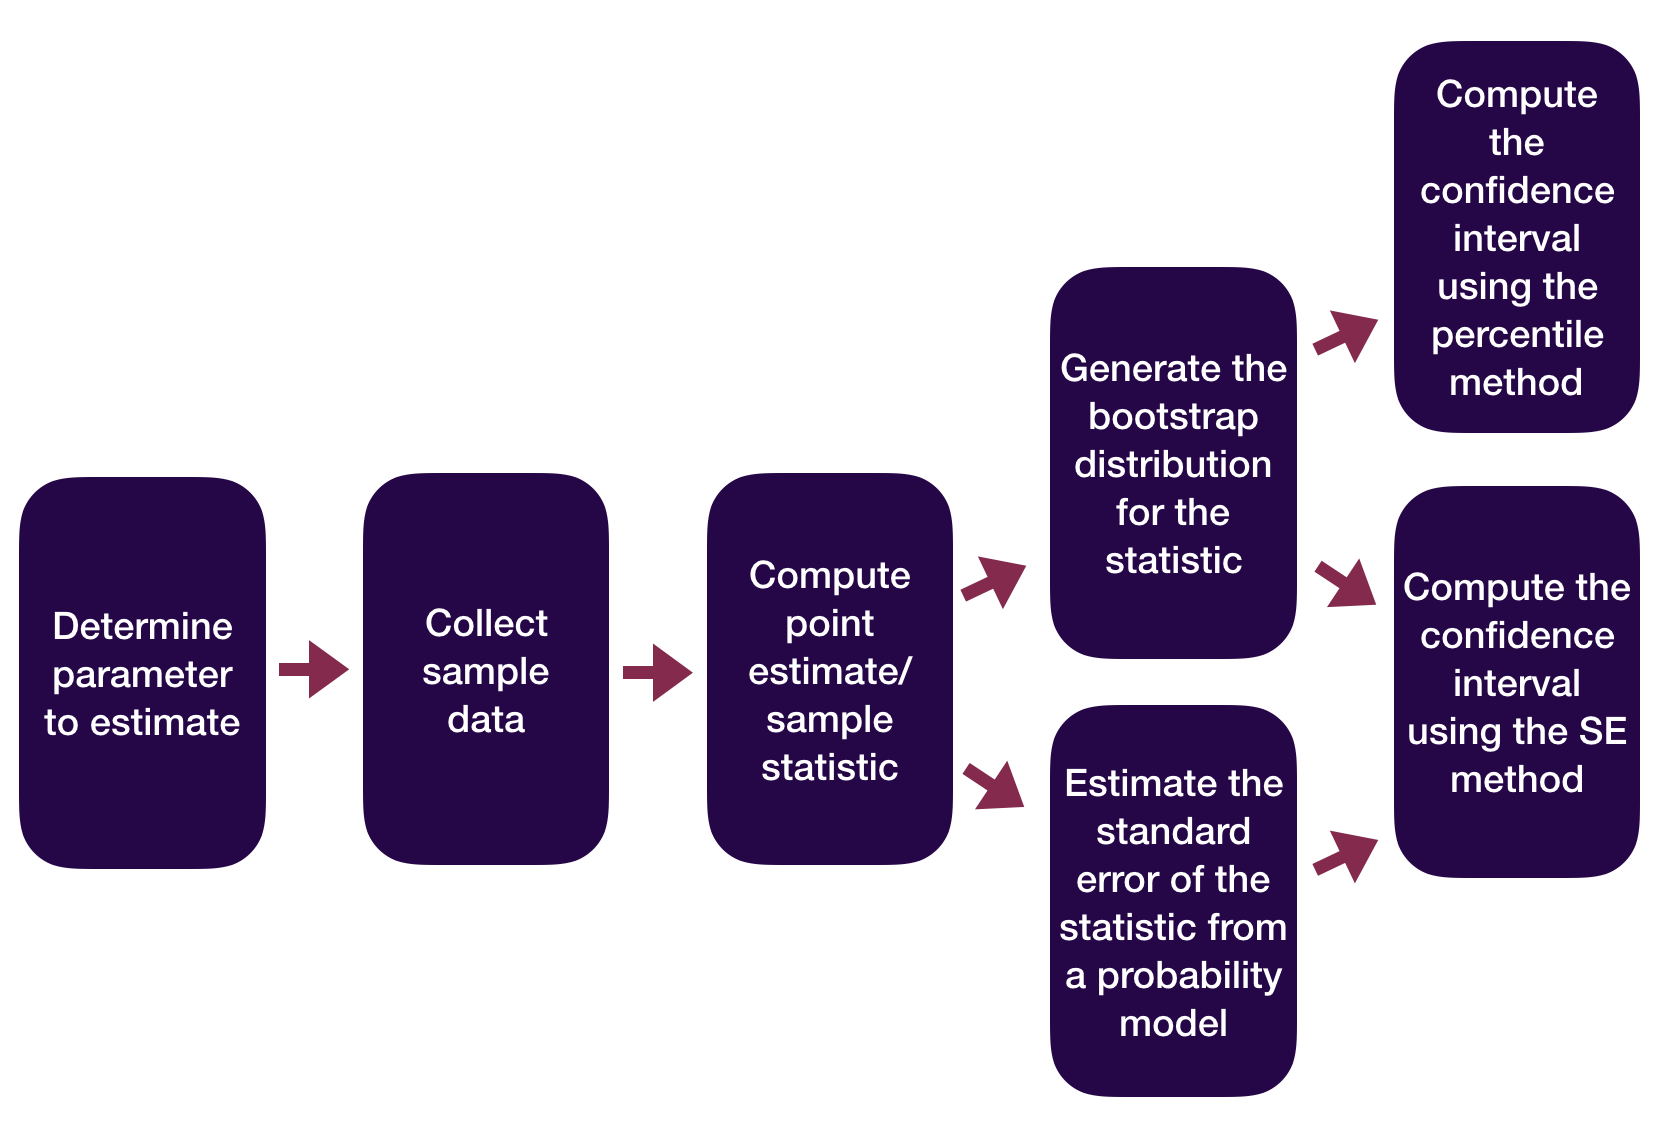
Question: How did folks do inference before computers?
Statistical Inference Zoom Out – Testing
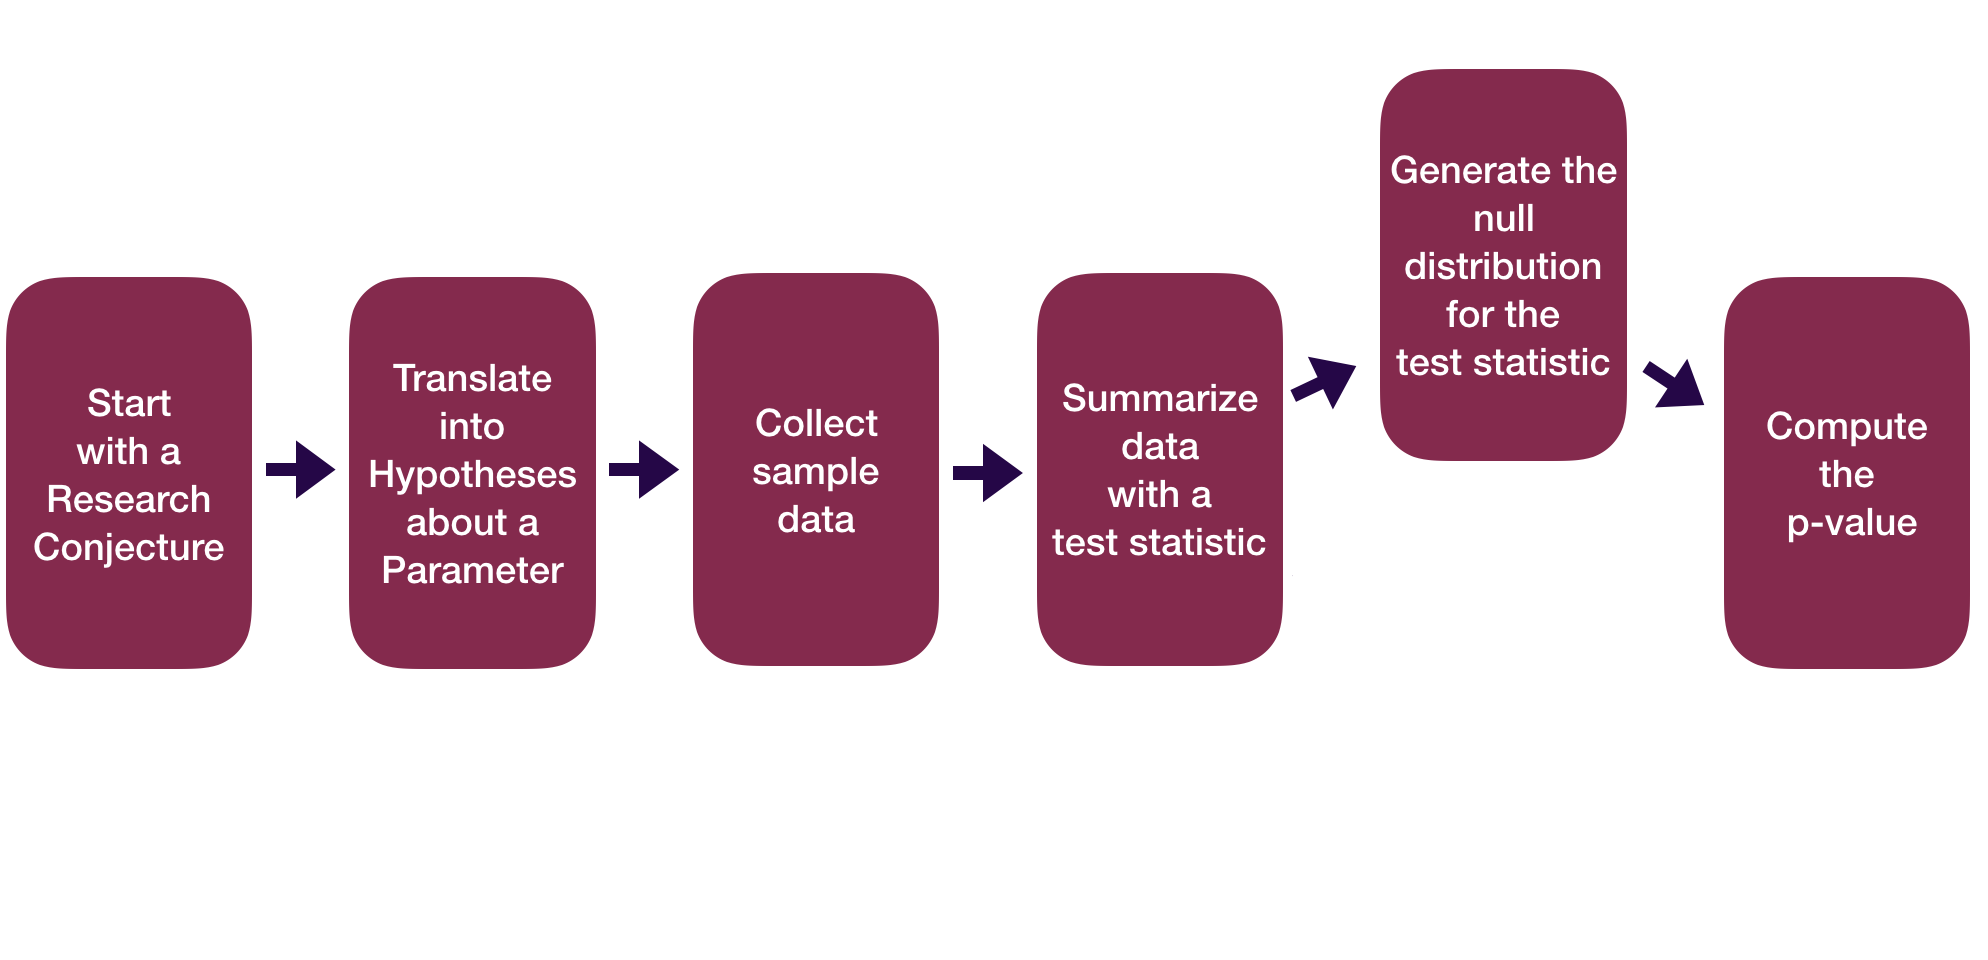
Question: How did folks do inference before computers?
Statistical Inference Zoom Out – Testing
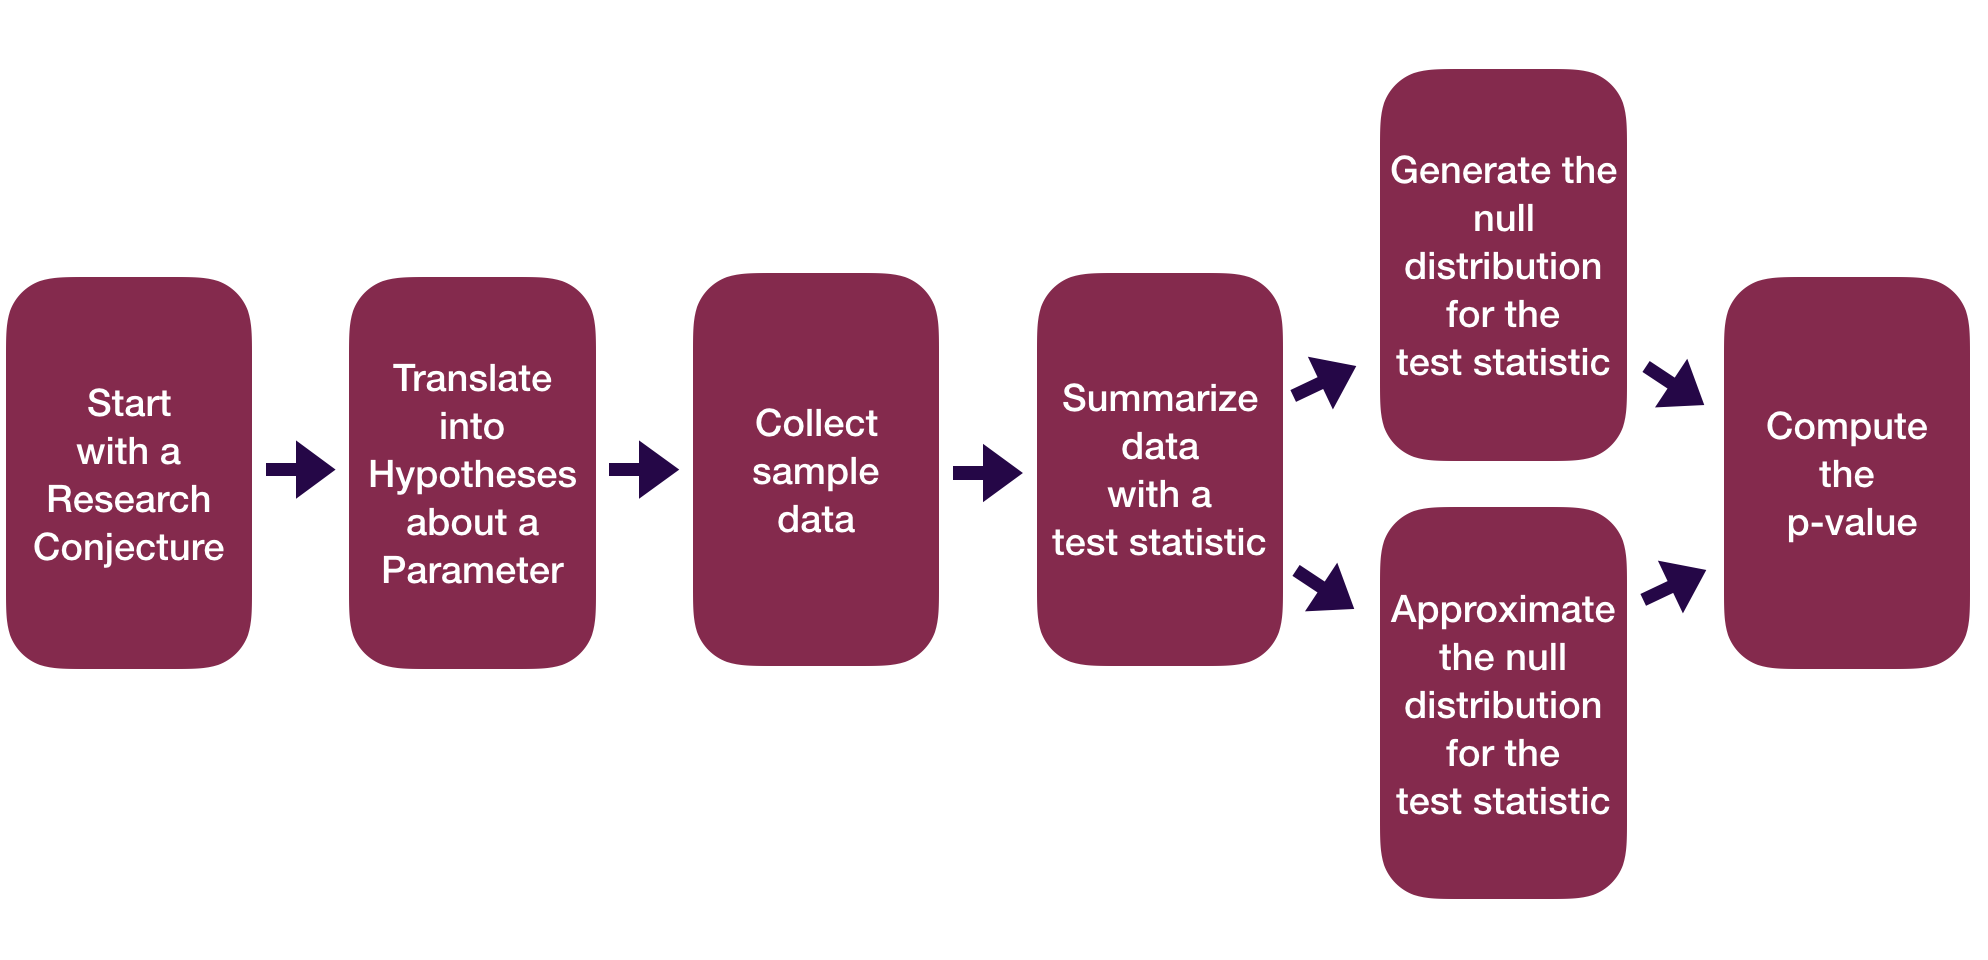
Question: How did folks do inference before computers?
Probability Models
Motivating question: How can we use theoretical probability models to approximate our (sampling) distributions?
Before we can answer that question and apply the models, we need to learn about the theoretical probability models themselves. We’ll turn to this after spring break!