
Sampling Distributions I
Megan Ayers
Math 141 | Spring 2026
Friday, Week 5
Goals for Today
Start learning the foundations of inference
Perform a group sampling activity
Discuss random sampling: the heart of statistics!
Drawing cards: Population, Sample, Parameter, and Statistic
- Today, we’re going to be:
- Randomly drawing 10 cards from a deck of cards
- Calculating the average value of our 10 cards
- Q: What is the sample? What is the population?
- Q: What is the statistic? What is the parameter?
Discussion
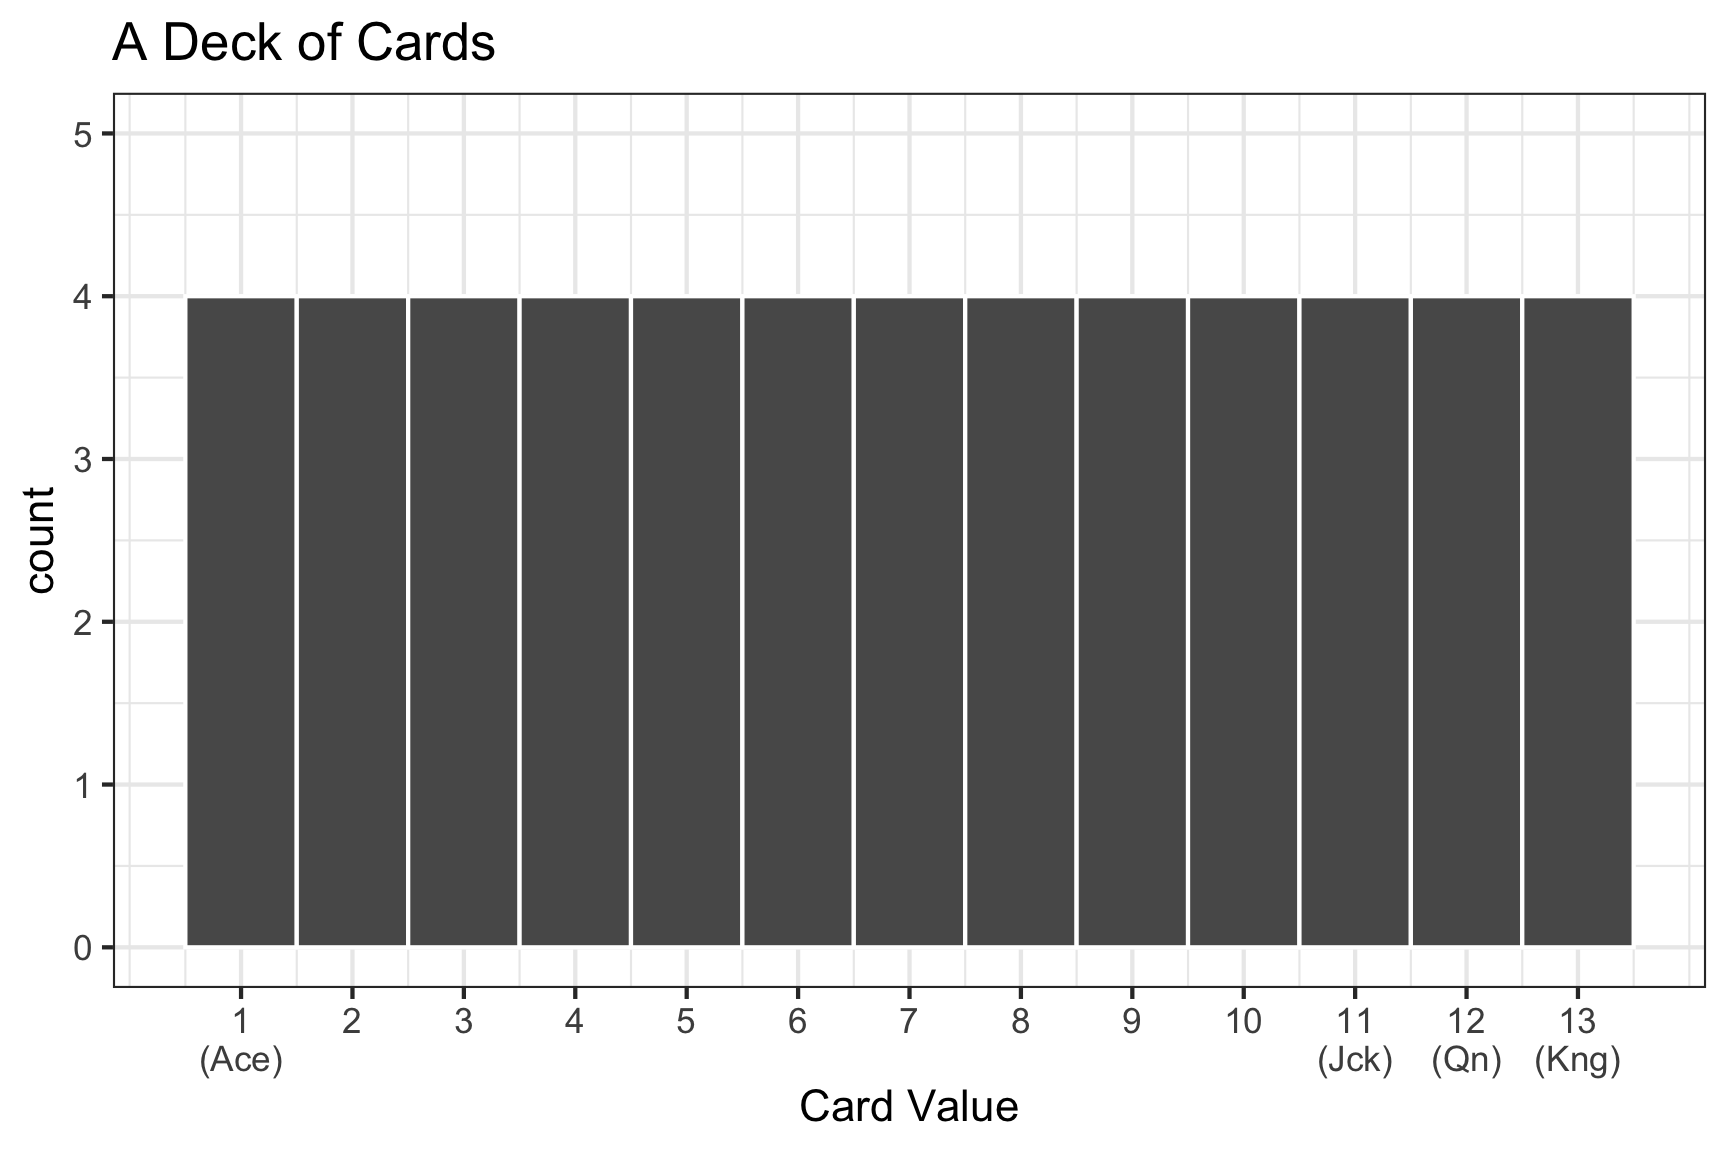
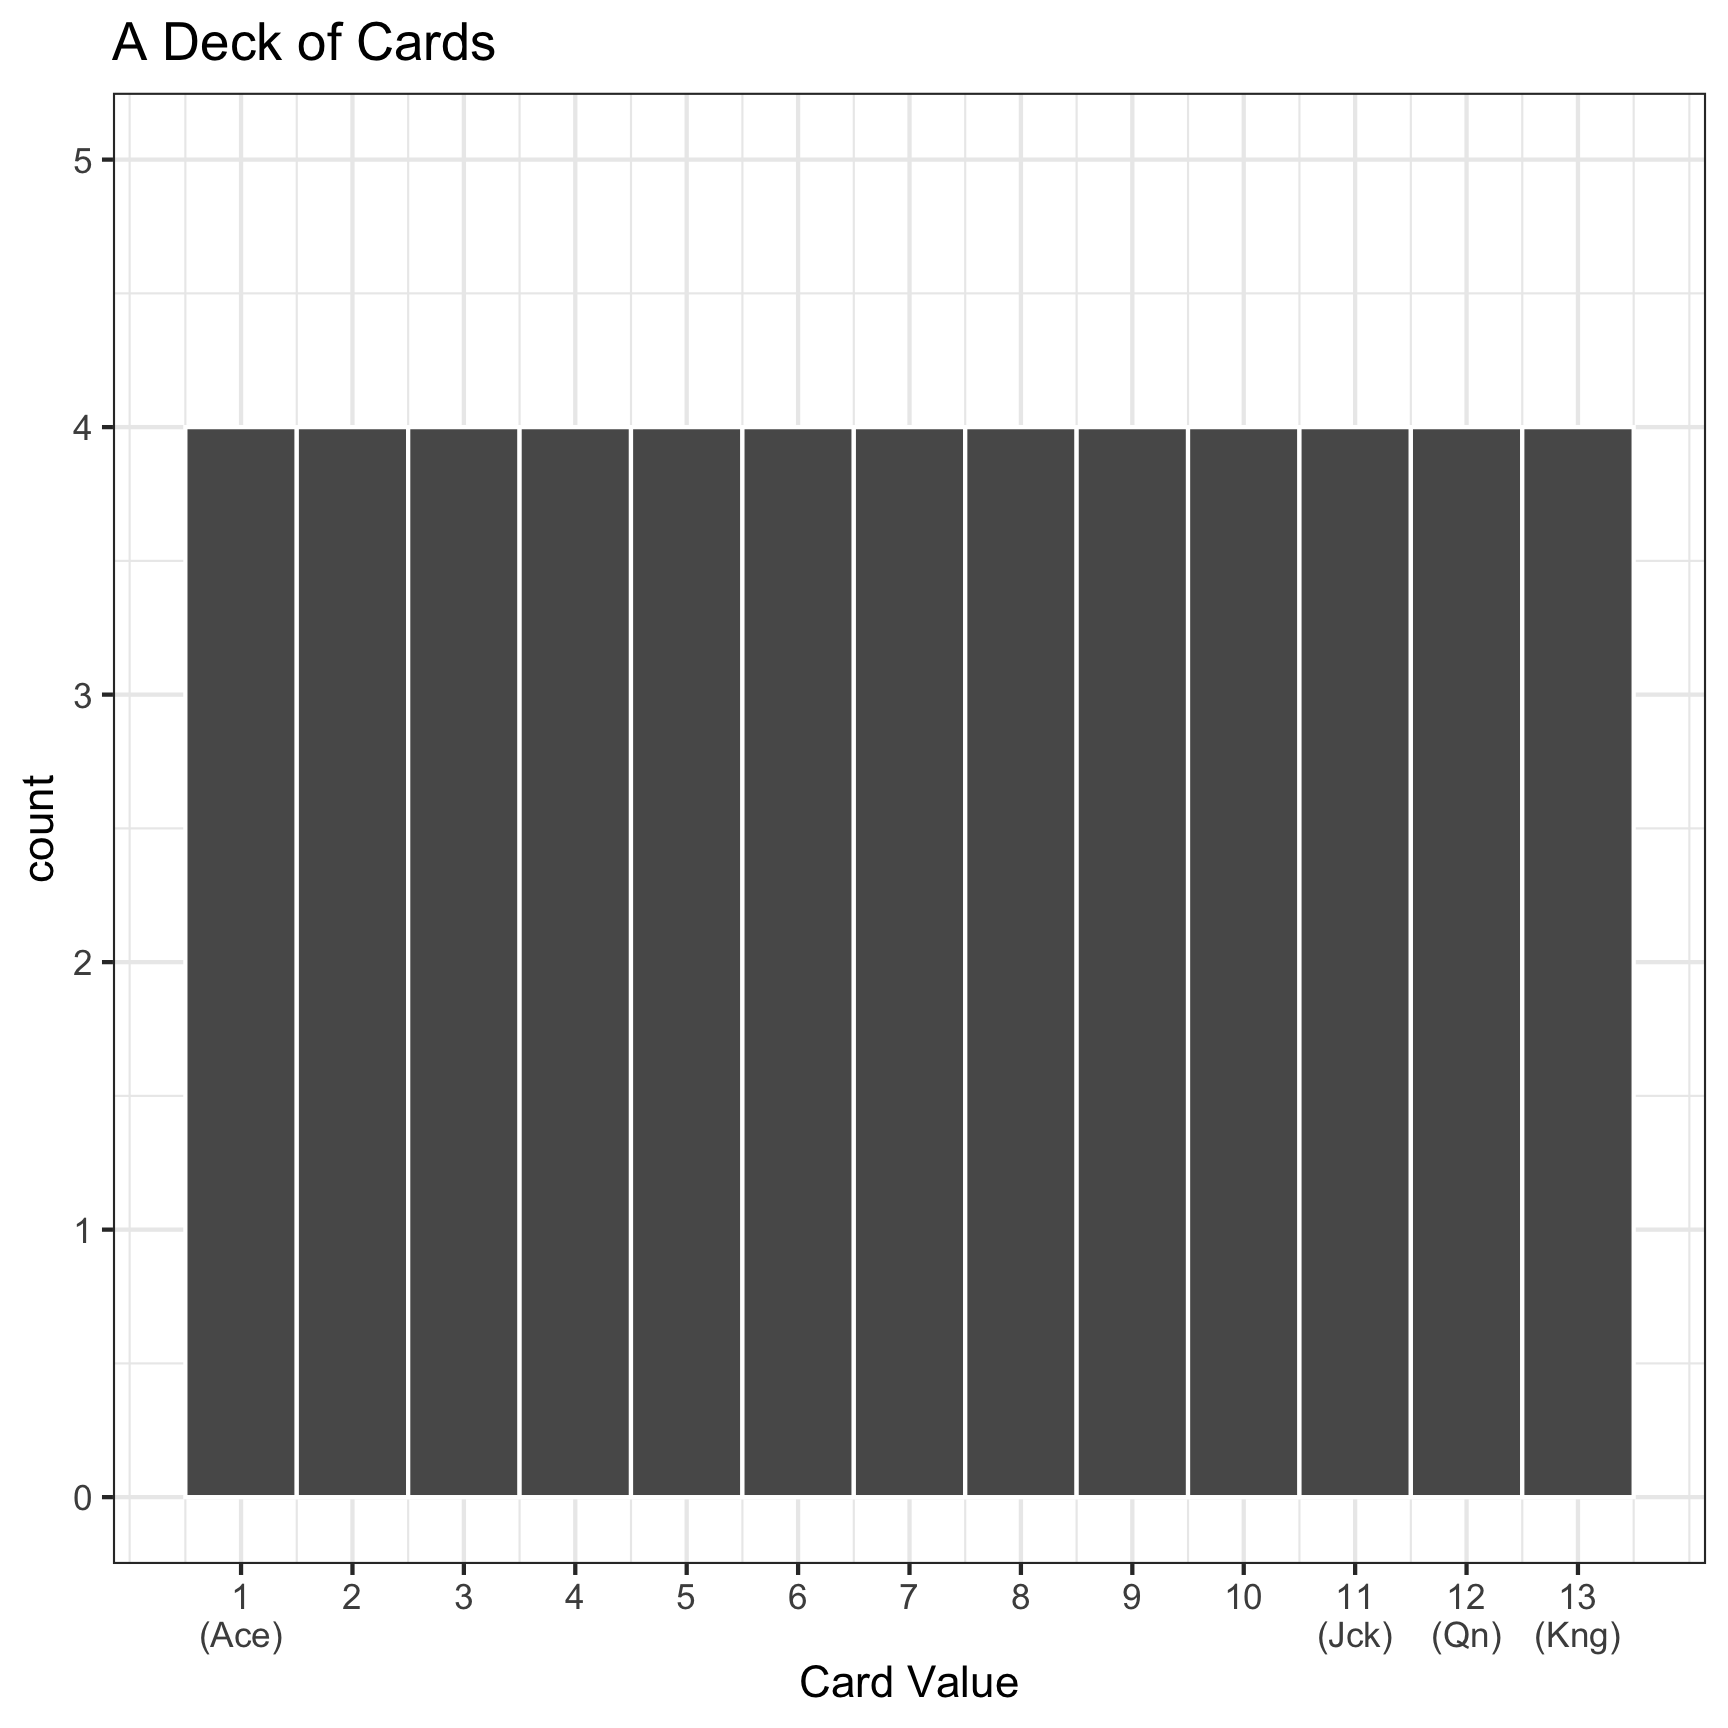
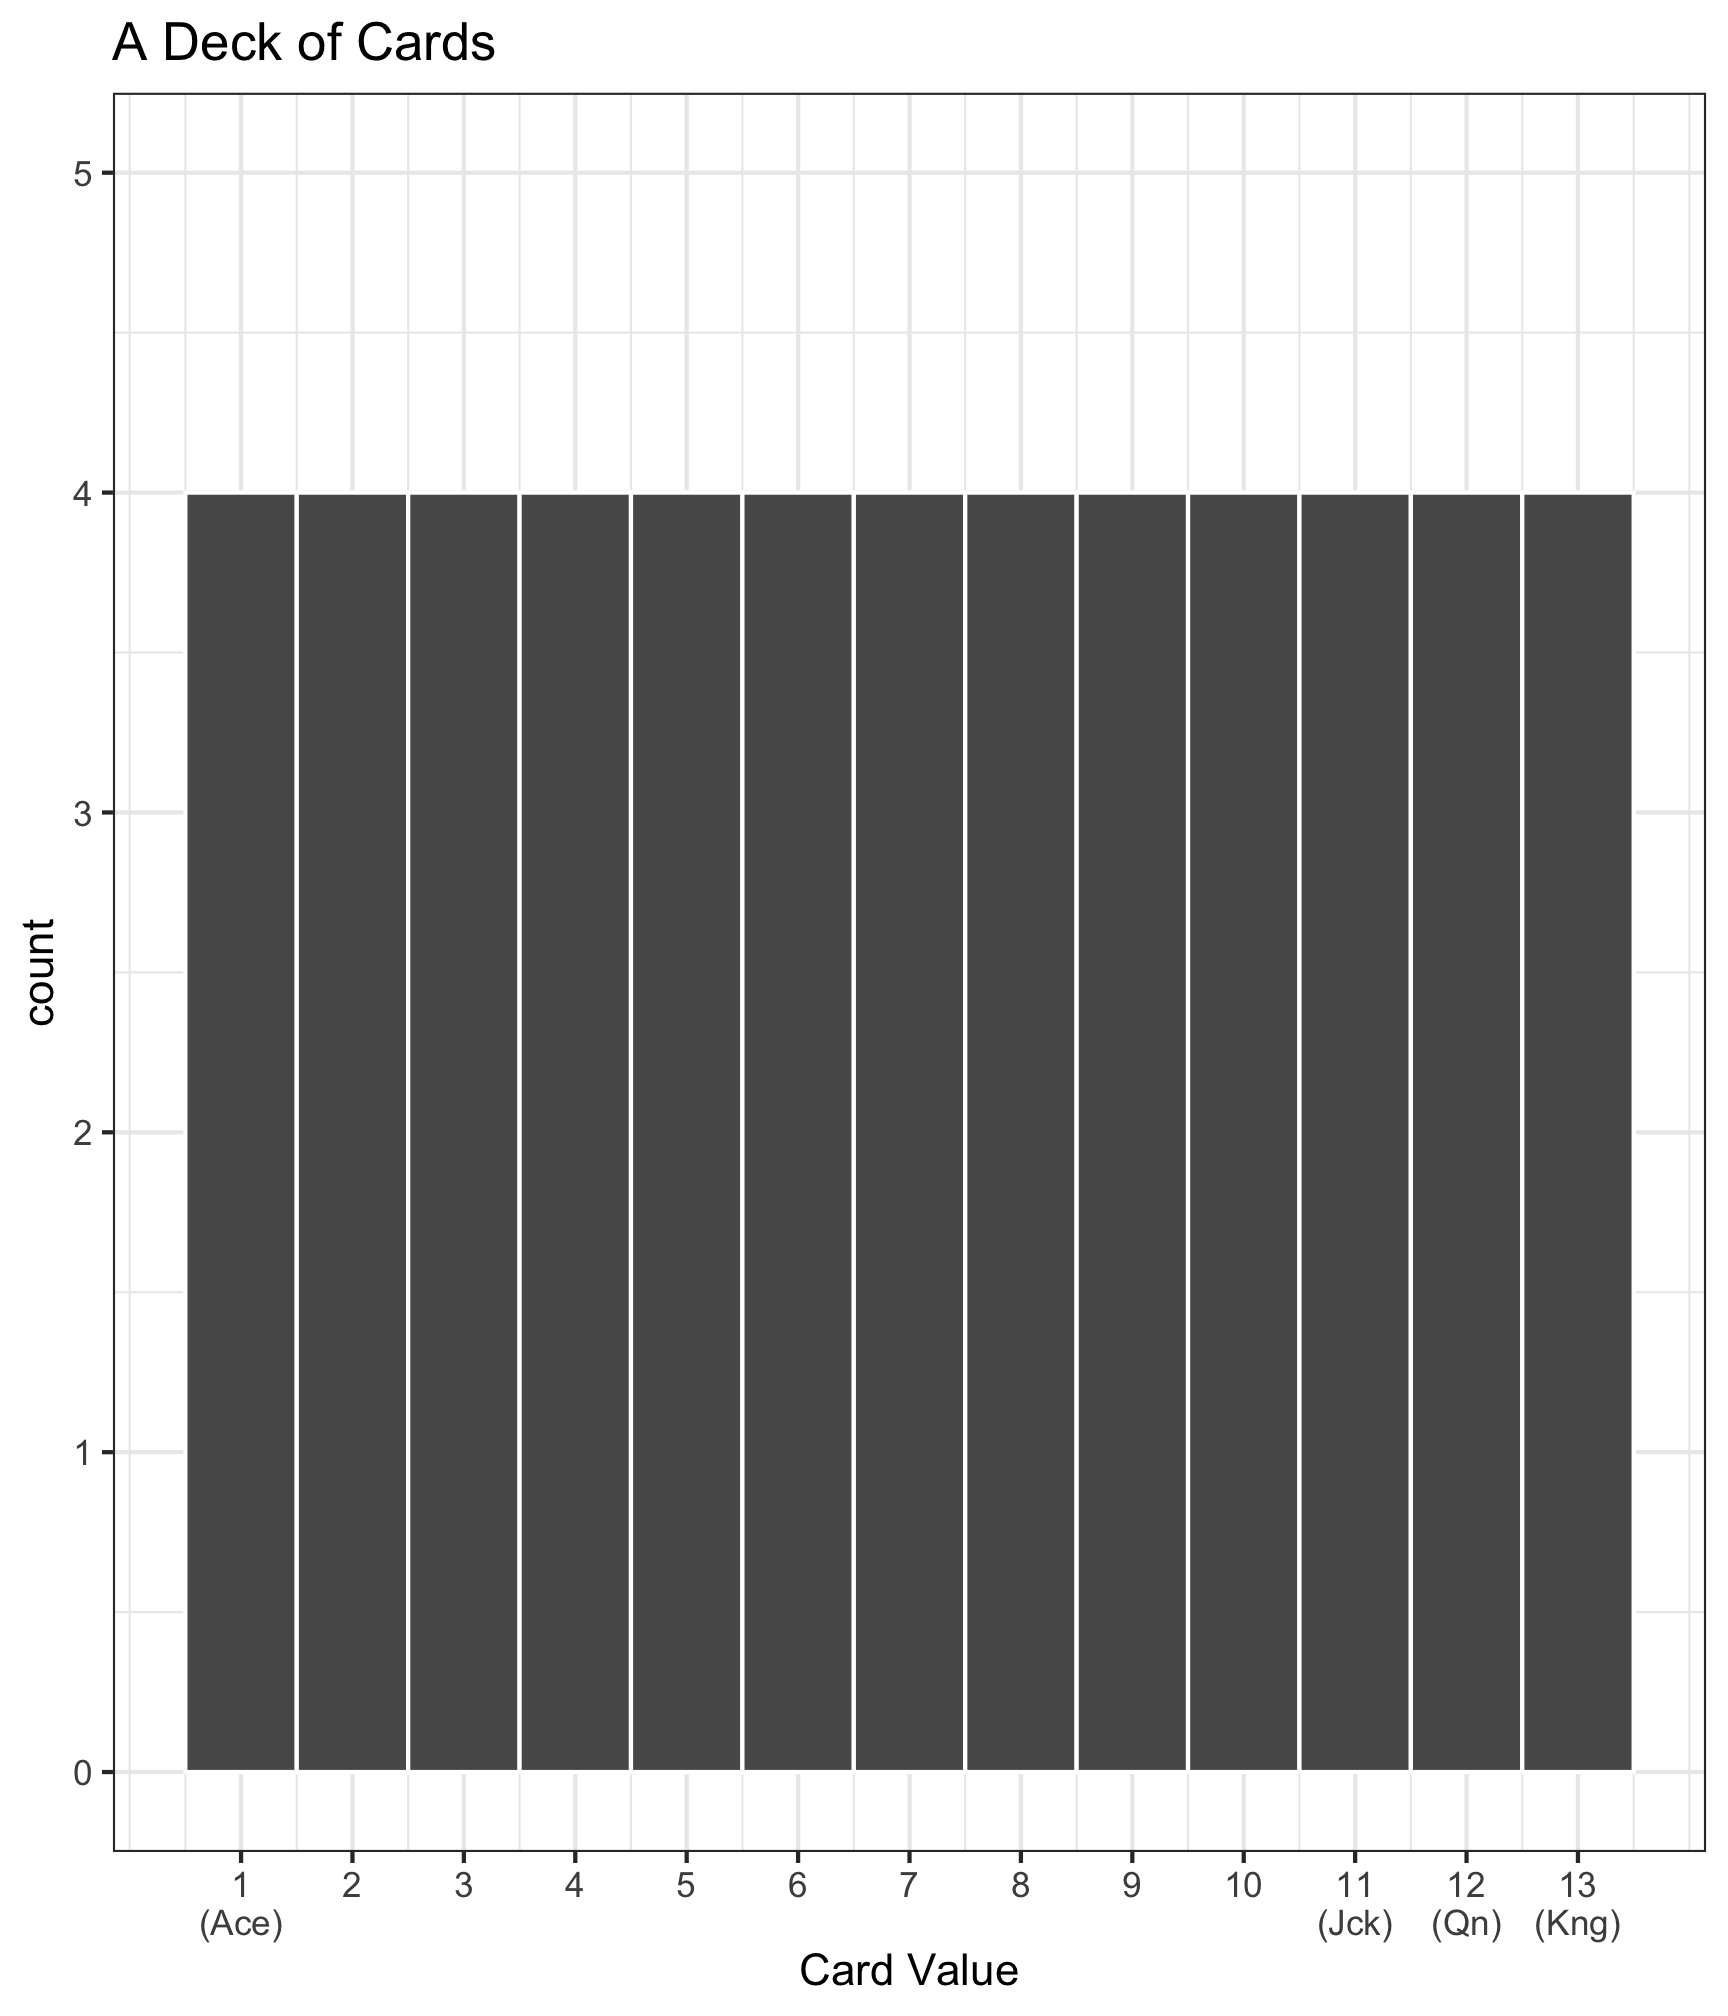
- What is the true average card value in a deck of cards?
- How does the distribution of sample means compare to the distribution of card values in a deck of cards?
- What is the relationship between the centers of the two distributions?
- Which distribution appears to have more variability?
- How do the shapes of the two distributions compare? Why do they differ?
Sampling Overview
- The distribution of a data set allows us to quantify the shape, center, and spread of the data.
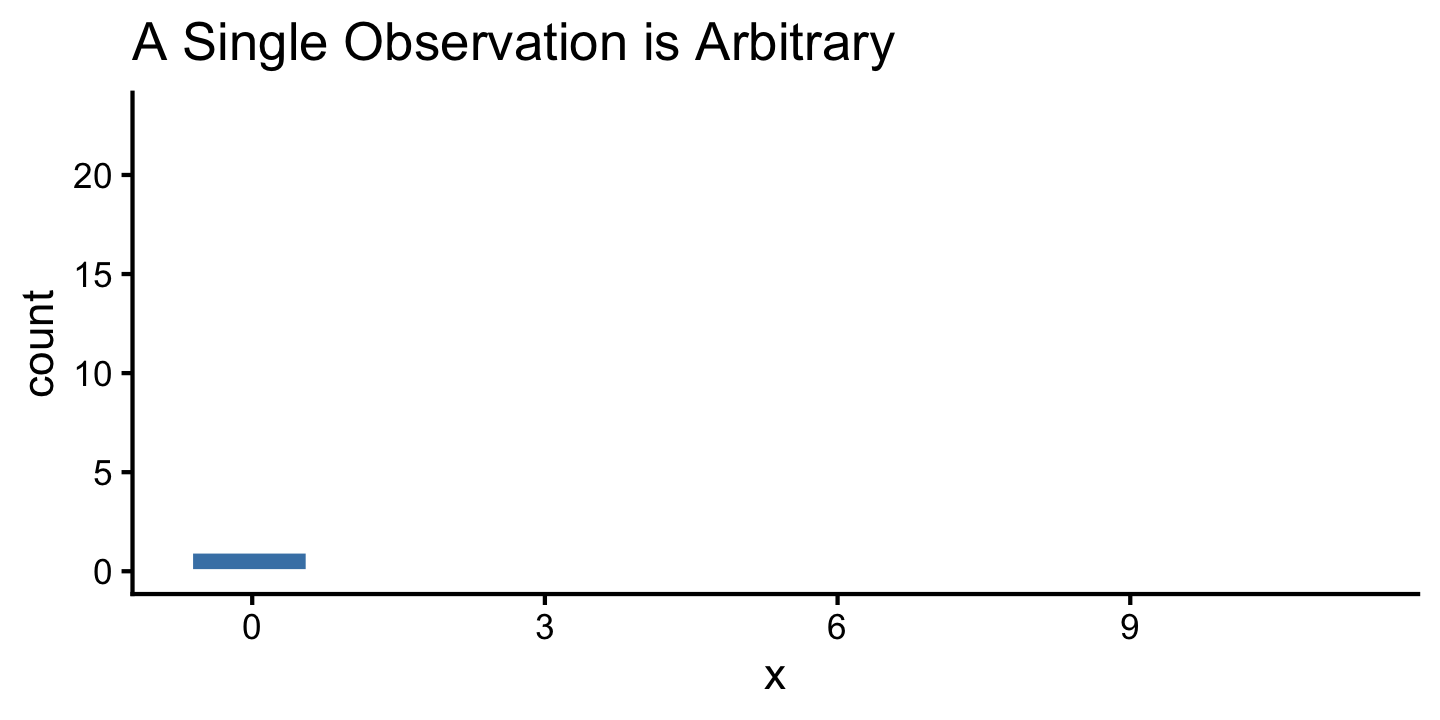
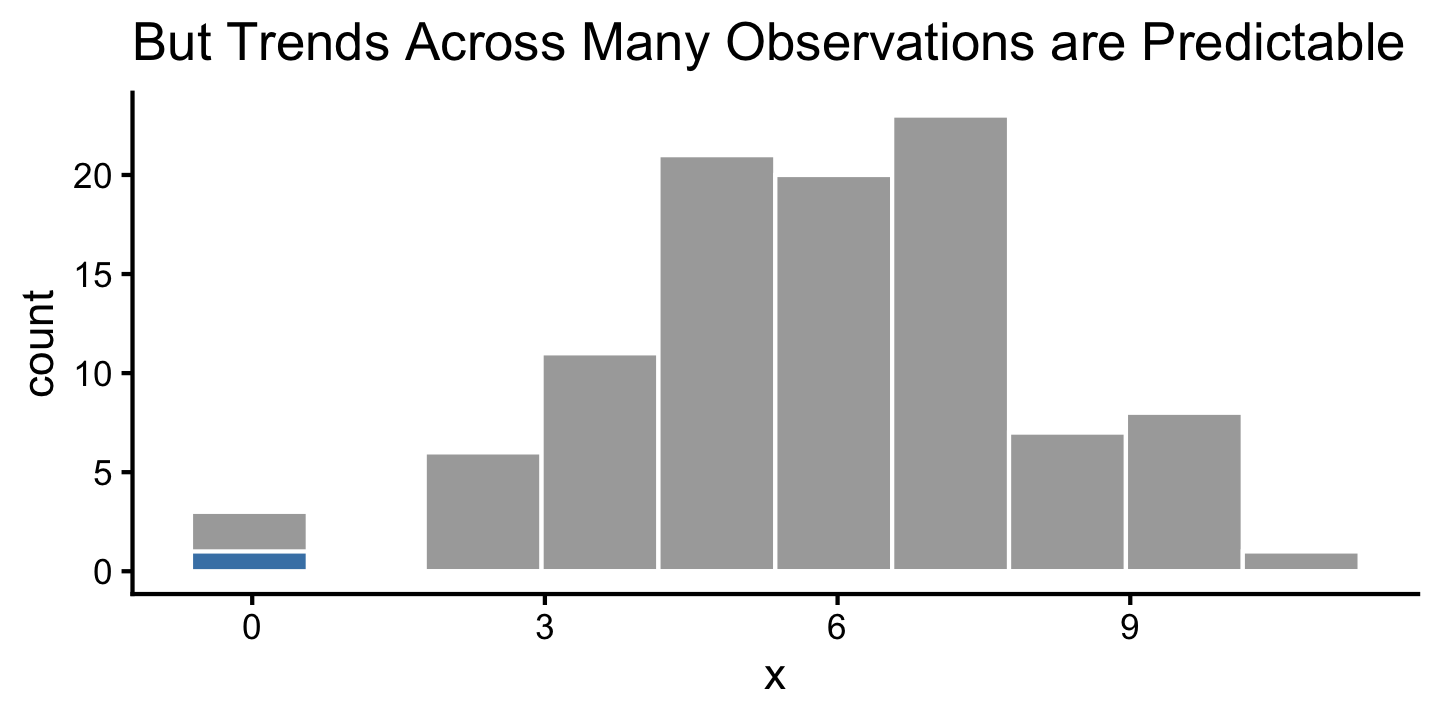
- While a single observation in a data set may appear arbitrary… repeated trials often show that outcomes follow certain patterns.
Sampling Overview
- The distribution of a data set allows us to quantify the shape, center, and spread of the data.
- While a single observation in a data set may appear arbitrary… repeated trials often show that outcomes follow certain patterns.
Sampling Overview
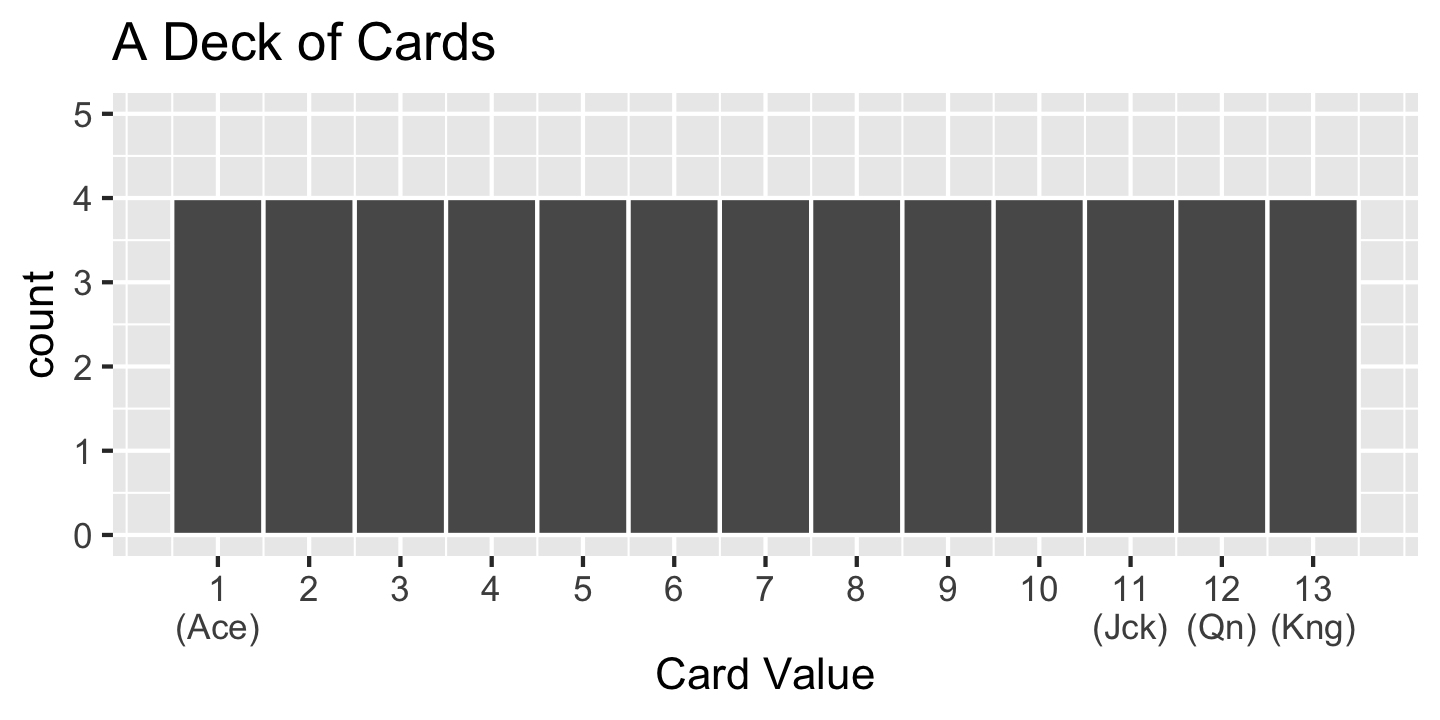
- We know that a variable from a population has a distribution
- e.g., the distribution of card values in a deck of cards
- Moral of Today: Statistics (e.g., mean of variable in a sample) have distributions too!!
- How? We only have ONE statistic – the statistic from the ONE sample we drew
- Distribution is over all the possible samples we could have drawn (we just see 1)
- Implication: Statistics themselves have a mean, standard deviation, 5-number summary
- The mean tells us the statistic’s typical value in a randomly chosen sample.
- The standard deviation tells us how the statistic fluctuates from sample to sample.
- Very Powerful: e.g., Can use this distribution to give plausible ranges for the parameter and a sense of uncertainty in a given statistic.
Bigger Picture - Quantifying Our Uncertainty
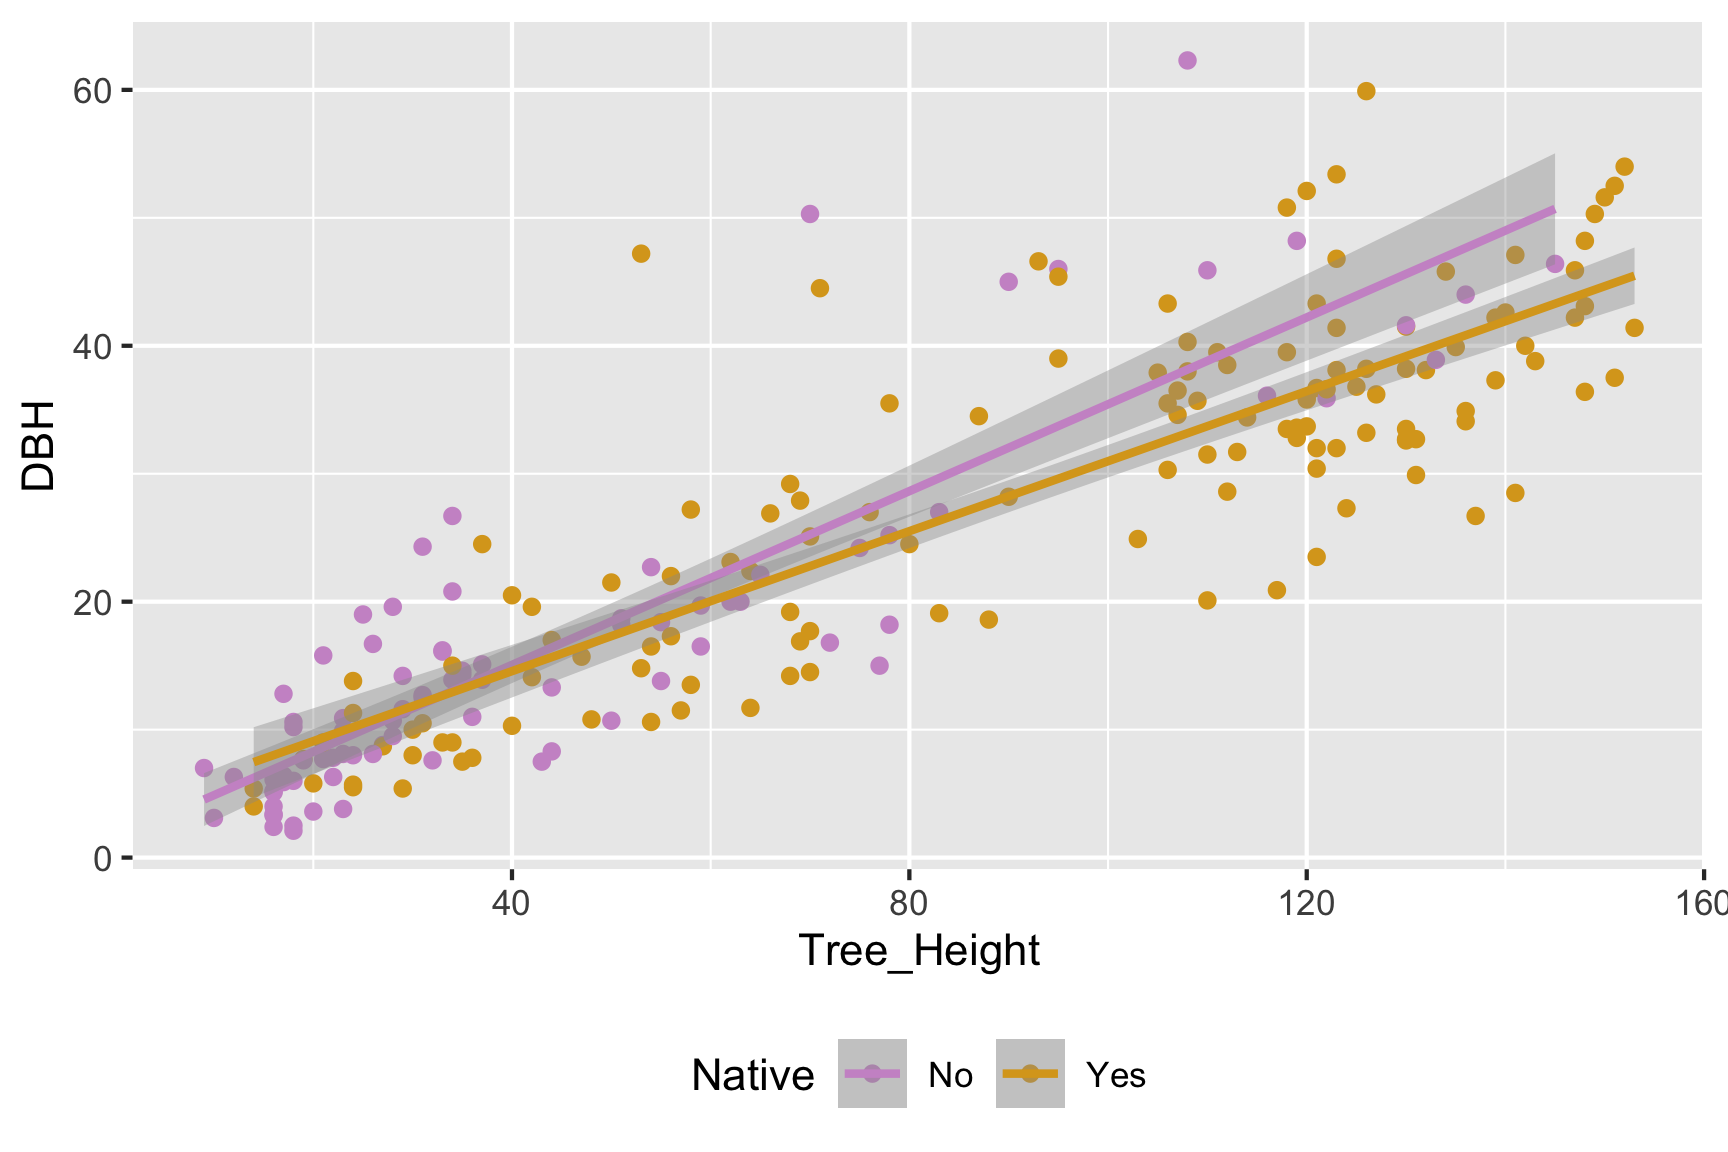
R has been giving us uncertainty estimates (ex. geom_smooth when we don’t set se = FALSE):
Bigger Picture - Quantifying Our Uncertainty in Statistics
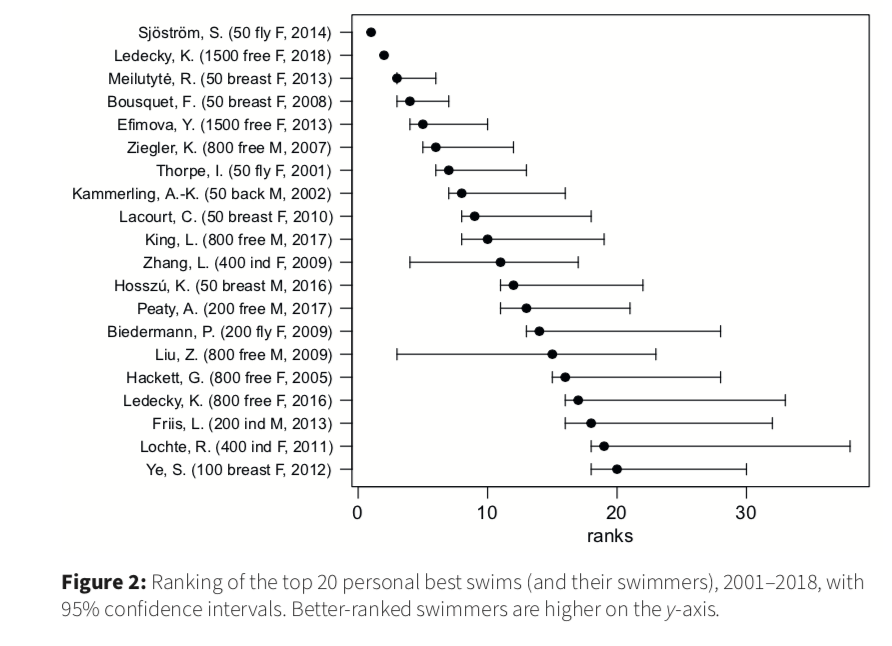
Uncertainty estimates are constantly reported in news and journal articles:
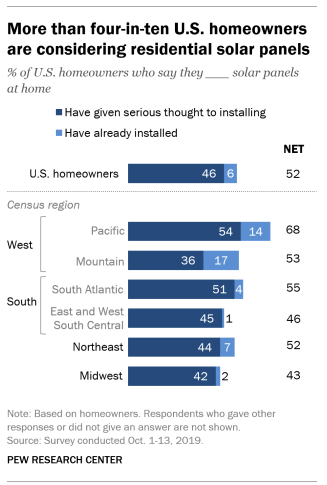
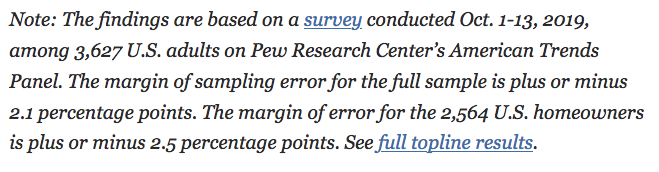
Bigger Picture - Quantifying Our Uncertainty in Statistics
Uncertainty estimates are constantly reported in news and journal articles: