

Study Design
Megan Ayers
Math 141 | Spring 2026
Friday, Week 3
Math/Stats course interest form
The Mathematics and Statistics Department is currently in the process of drafting a schedule for next academic year. In order to have a better sense of how many sections of each class to offer, we would like to know your plans for next year.
- MATH 111: Calculus
- MATH 112: Intro to Analysis
- MATH 113: Discrete Structures
- MATH 201: Linear Algebra
- MATH 202: Vector Calculus
- MATH 291: Probability
- MATH 321: Real Analysis
- MATH 332: Abstract Algebra
- STAT 241: *Data Science*
- STAT 243: *Statistical Learning*
- STAT 343: Statistics Practicum
- STAT 394: Causal Inference
Who are the data supposed to represent?
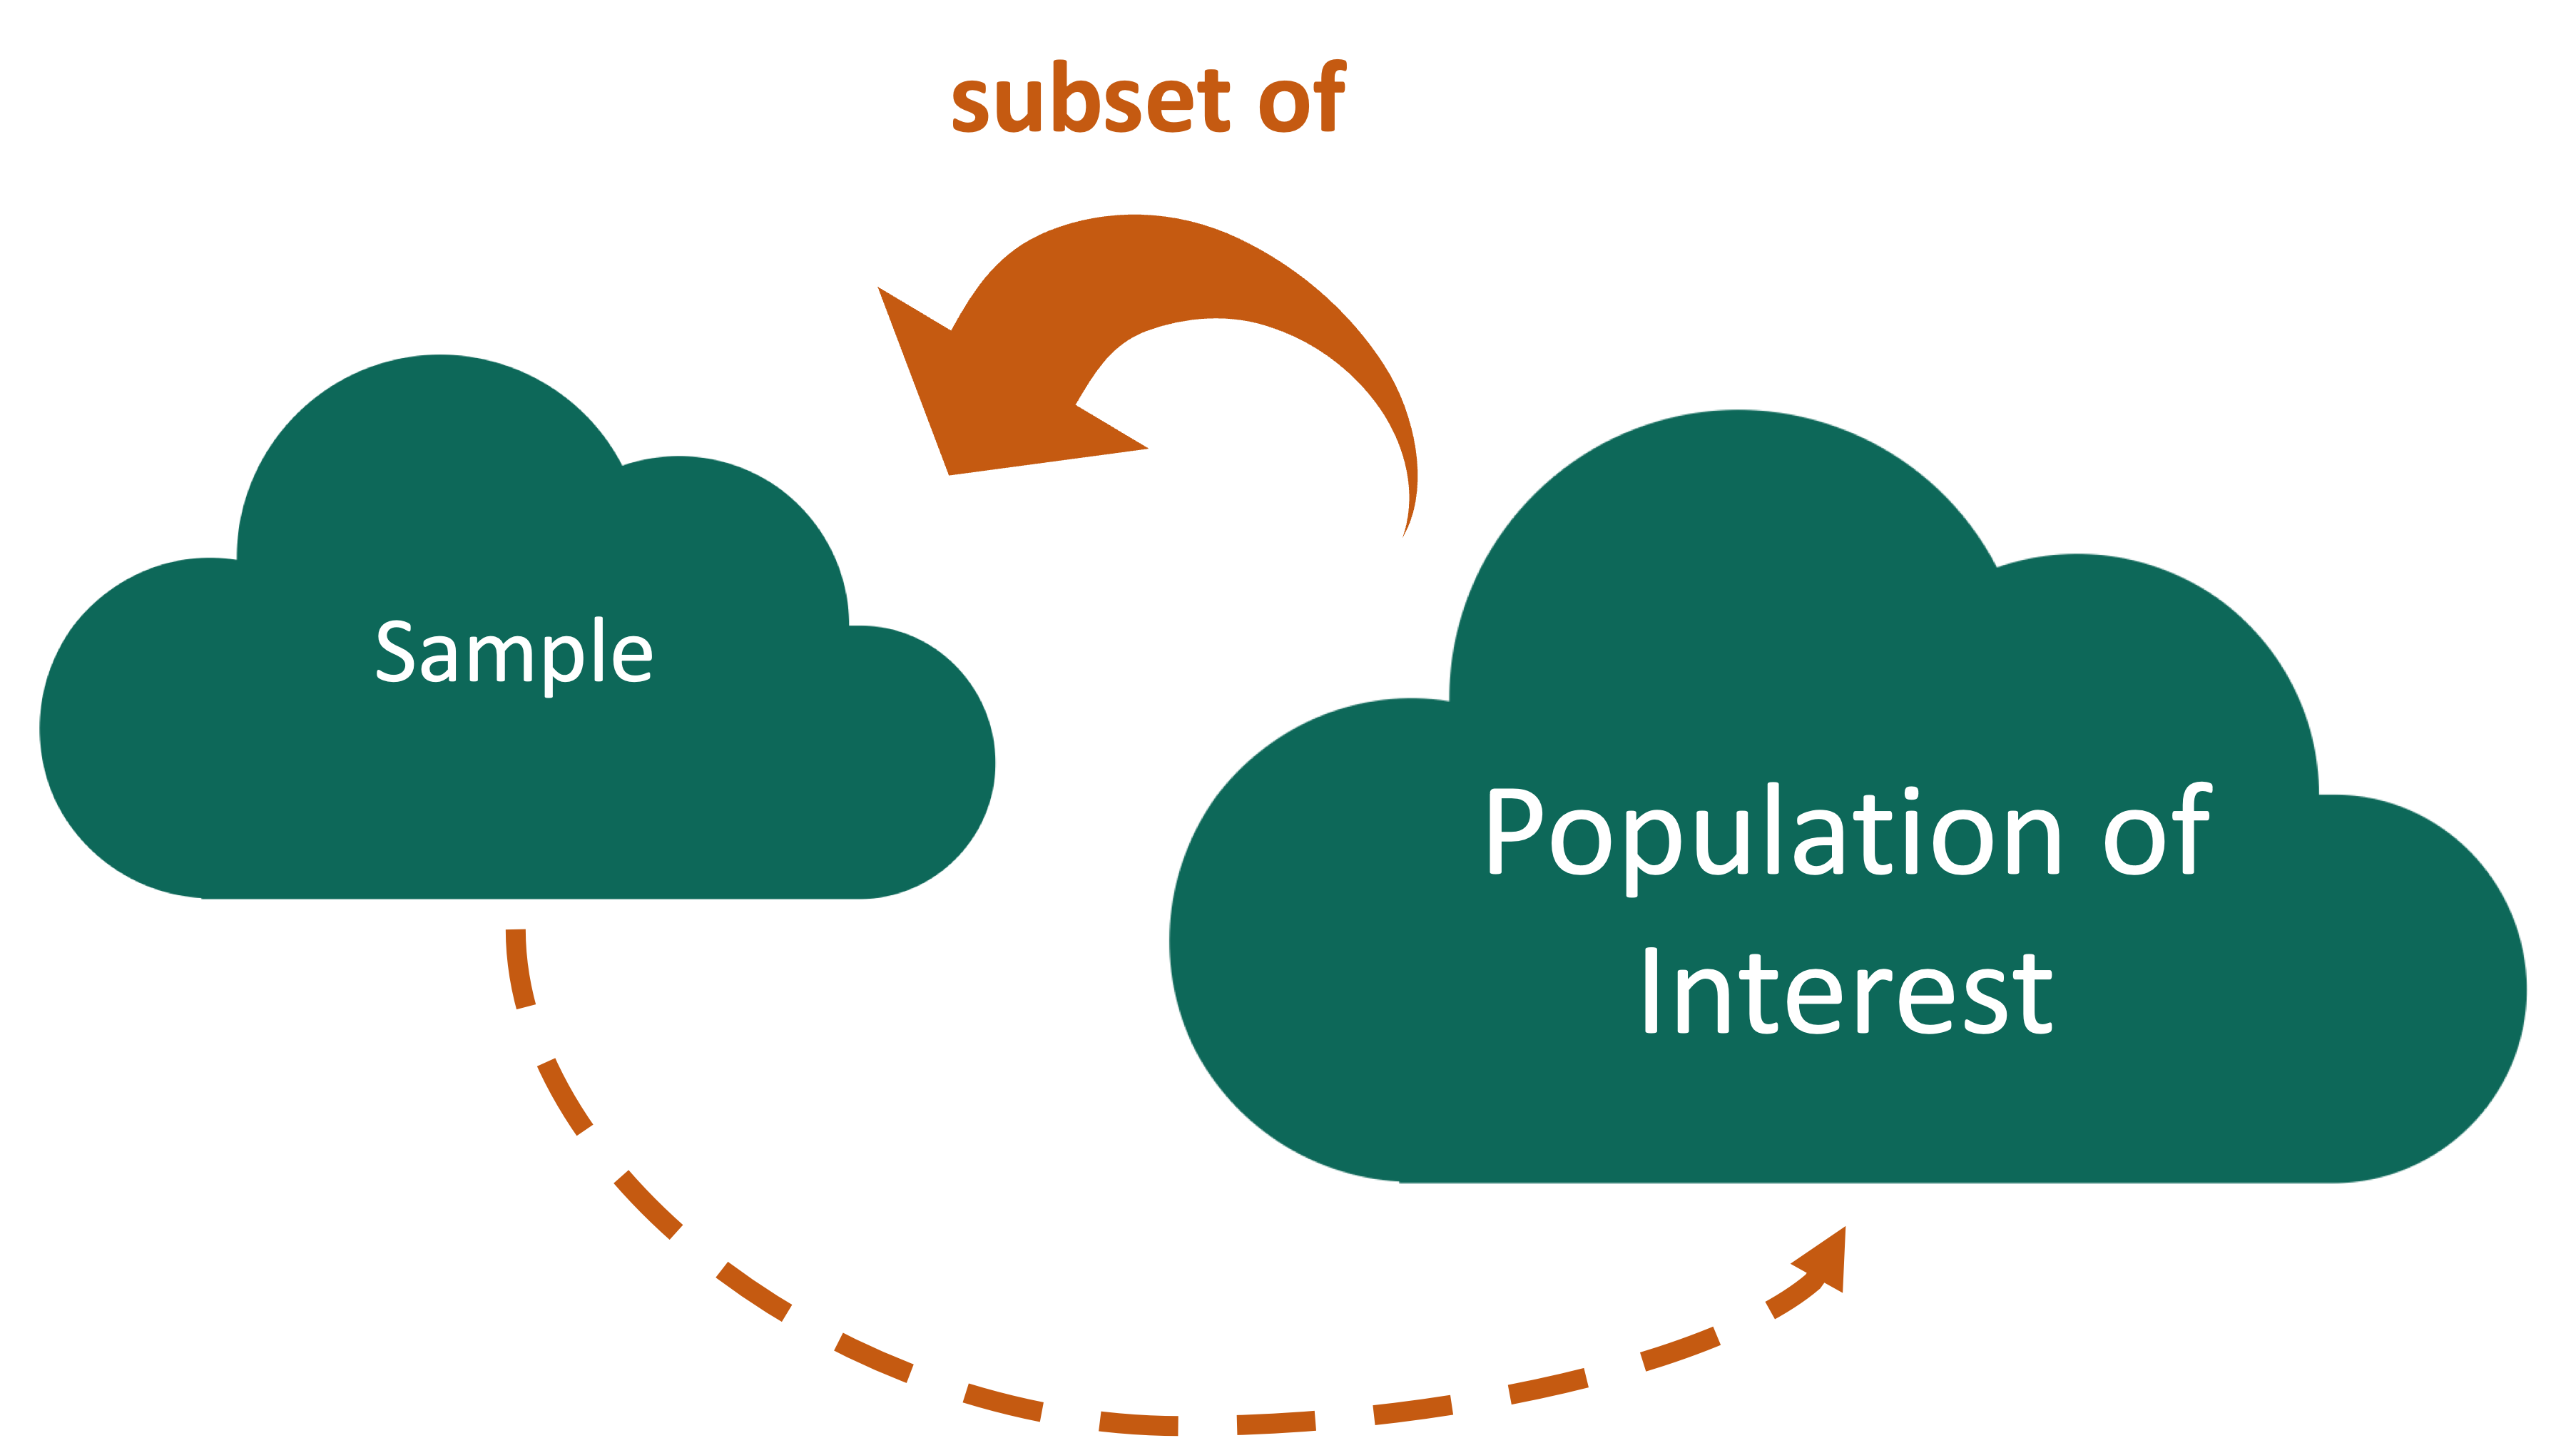
Who are the data supposed to represent?
Key questions:
- What evidence is there that the respondents are representative of the population?
- Who is present? Who is absent?
- Who is overrepresented? Who is underrepresented?
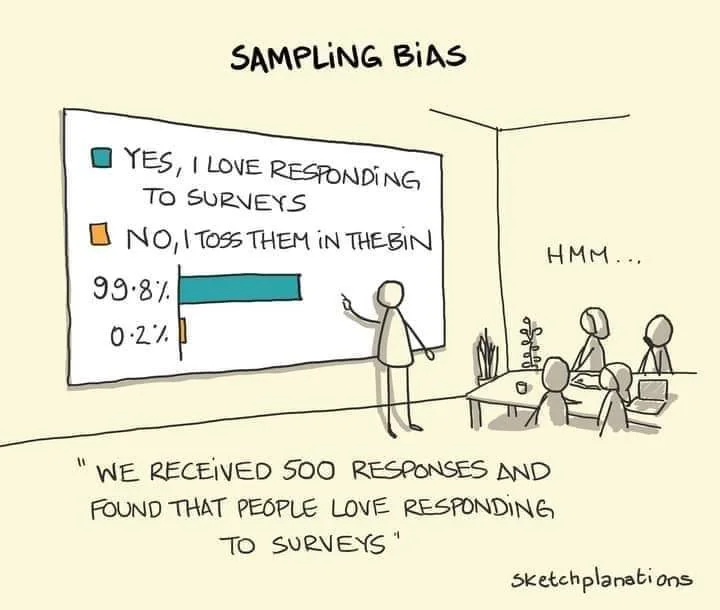
Nonresponse bias
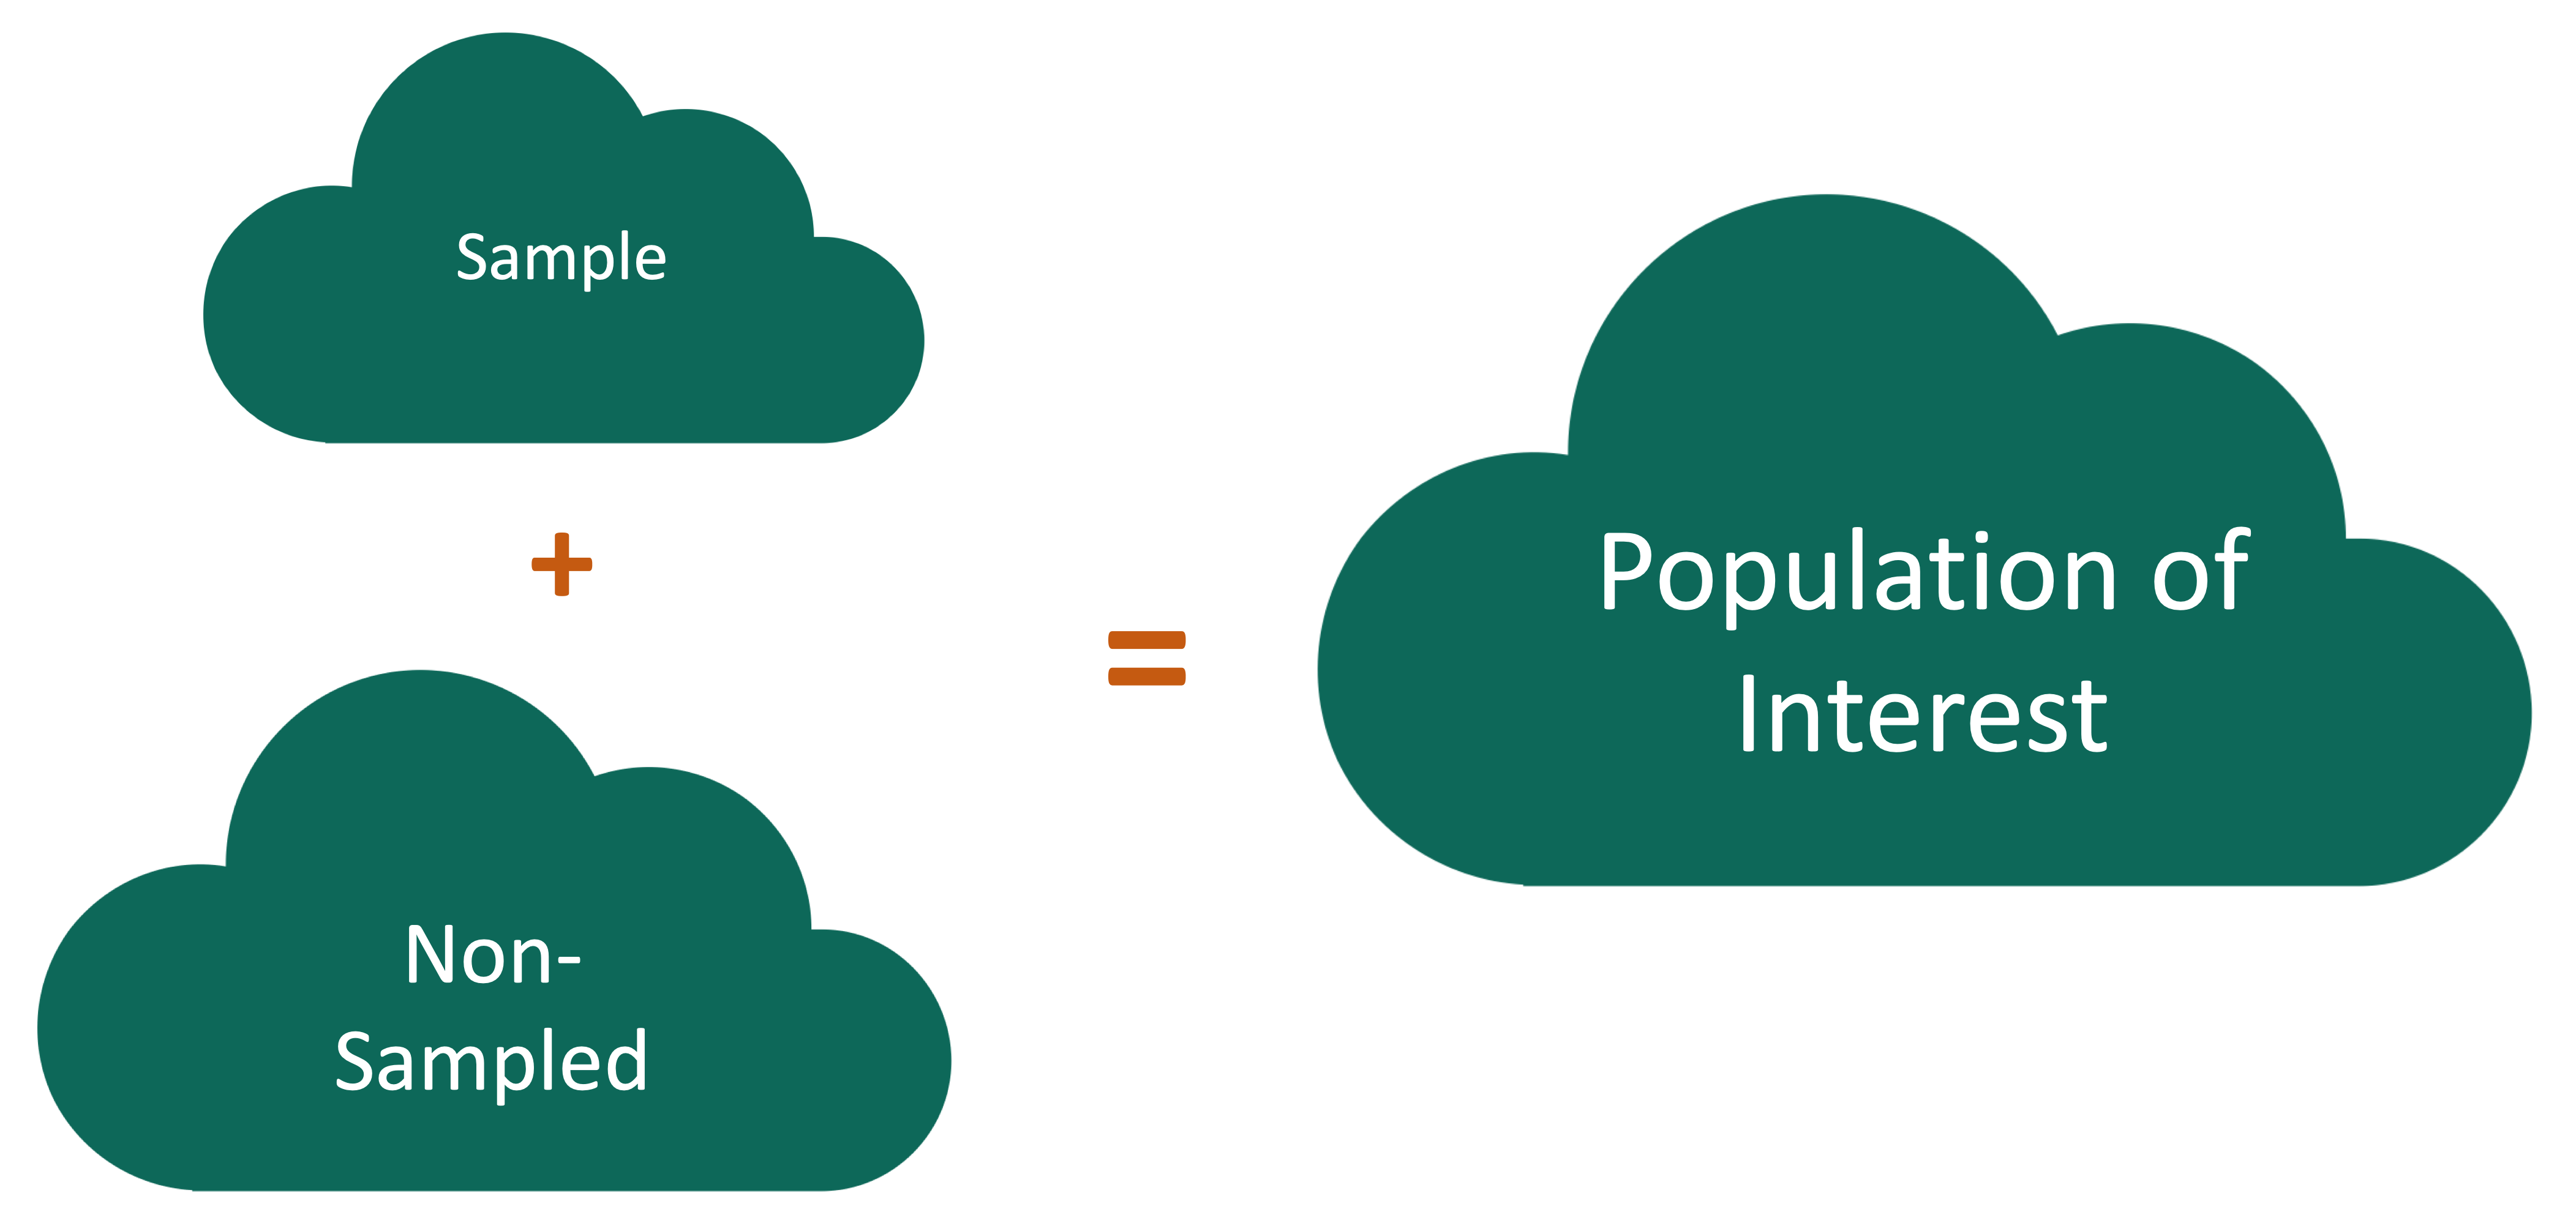
Nonresponse bias: The respondents are systematically different from the non-respondents for the variables of interest.
Nonresponse bias
Nonresponse bias: The respondents are systematically different from the non-respondents for the variables of interest.
Tackling Nonresponse bias
Use multiple modes (mail, phone, in-person) and multiple attempts for reaching sampled cases.
Explore key demographic variables to see how respondents and non-respondents vary.
In survey statistics, we can create survey weights to adjust for potential nonresponse bias.