
Data Collection and Sampling
Megan Ayers
Math 141 | Spring 2026
Wednesday, Week 3
Announcements/Reminders

Now for Data Collection
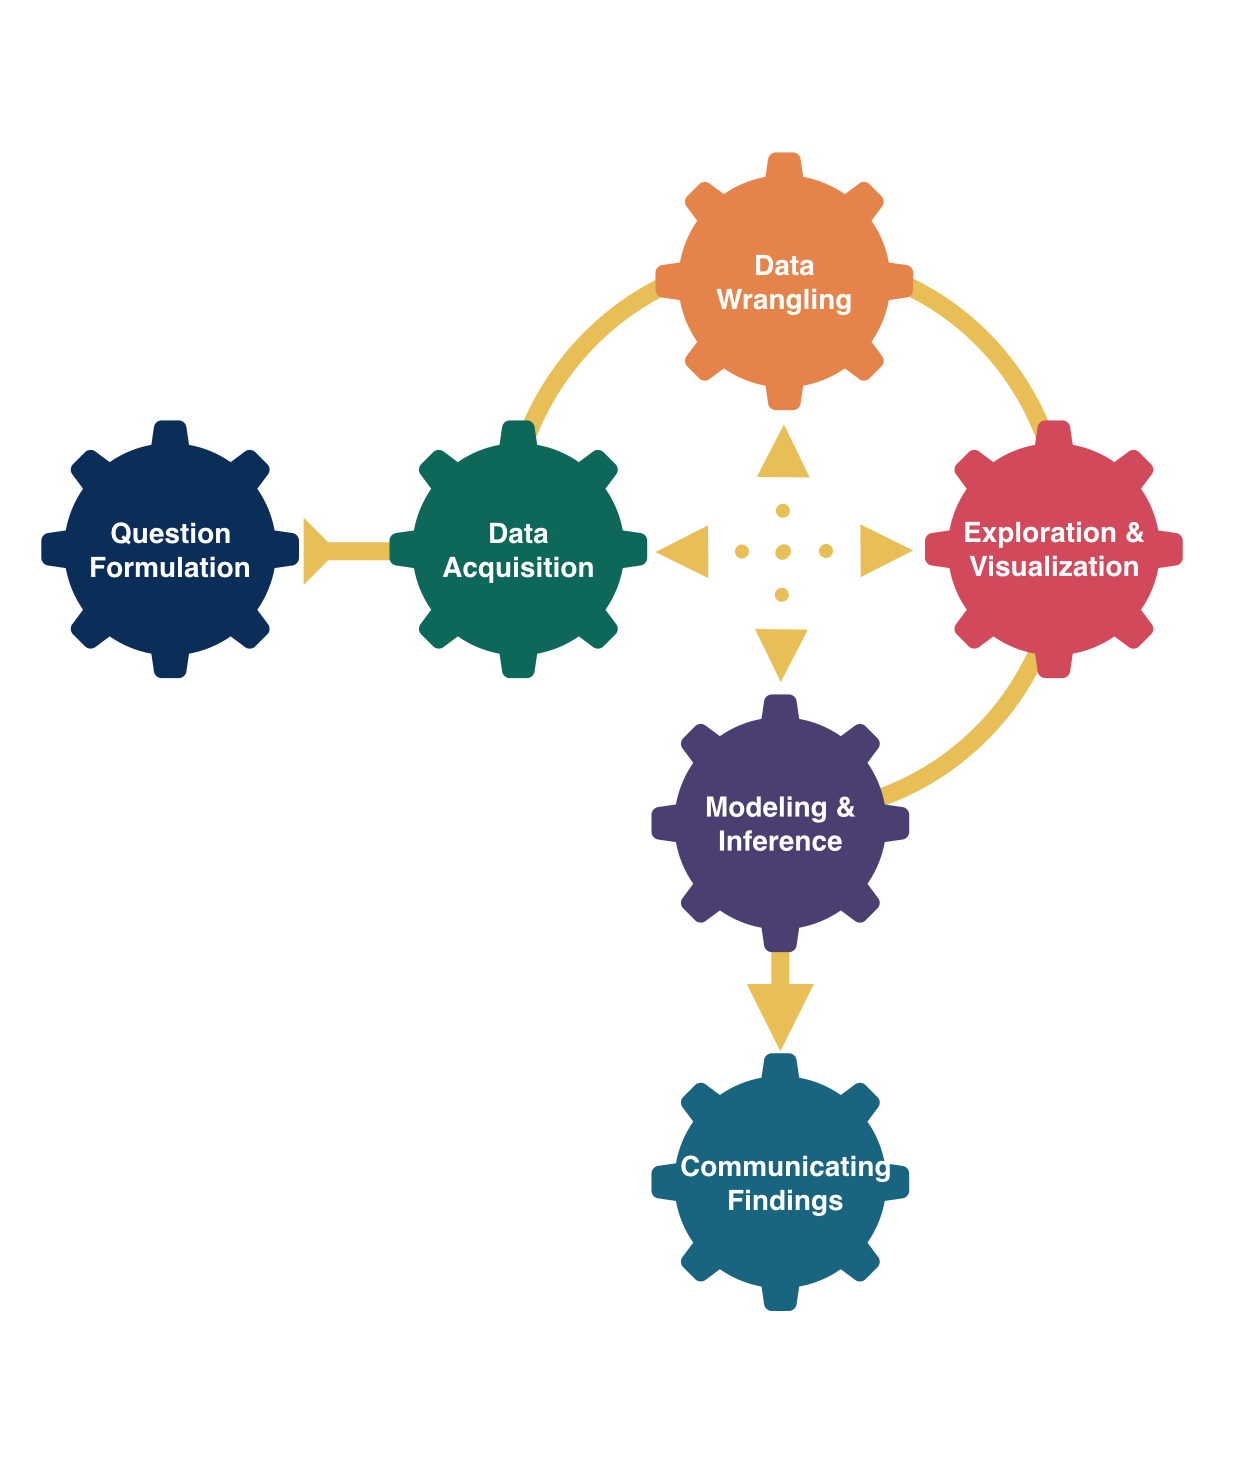
Who are the data supposed to represent?
In a census, we have data on the entire population!
But usually, we don’t have the money, time, or ability to do this.
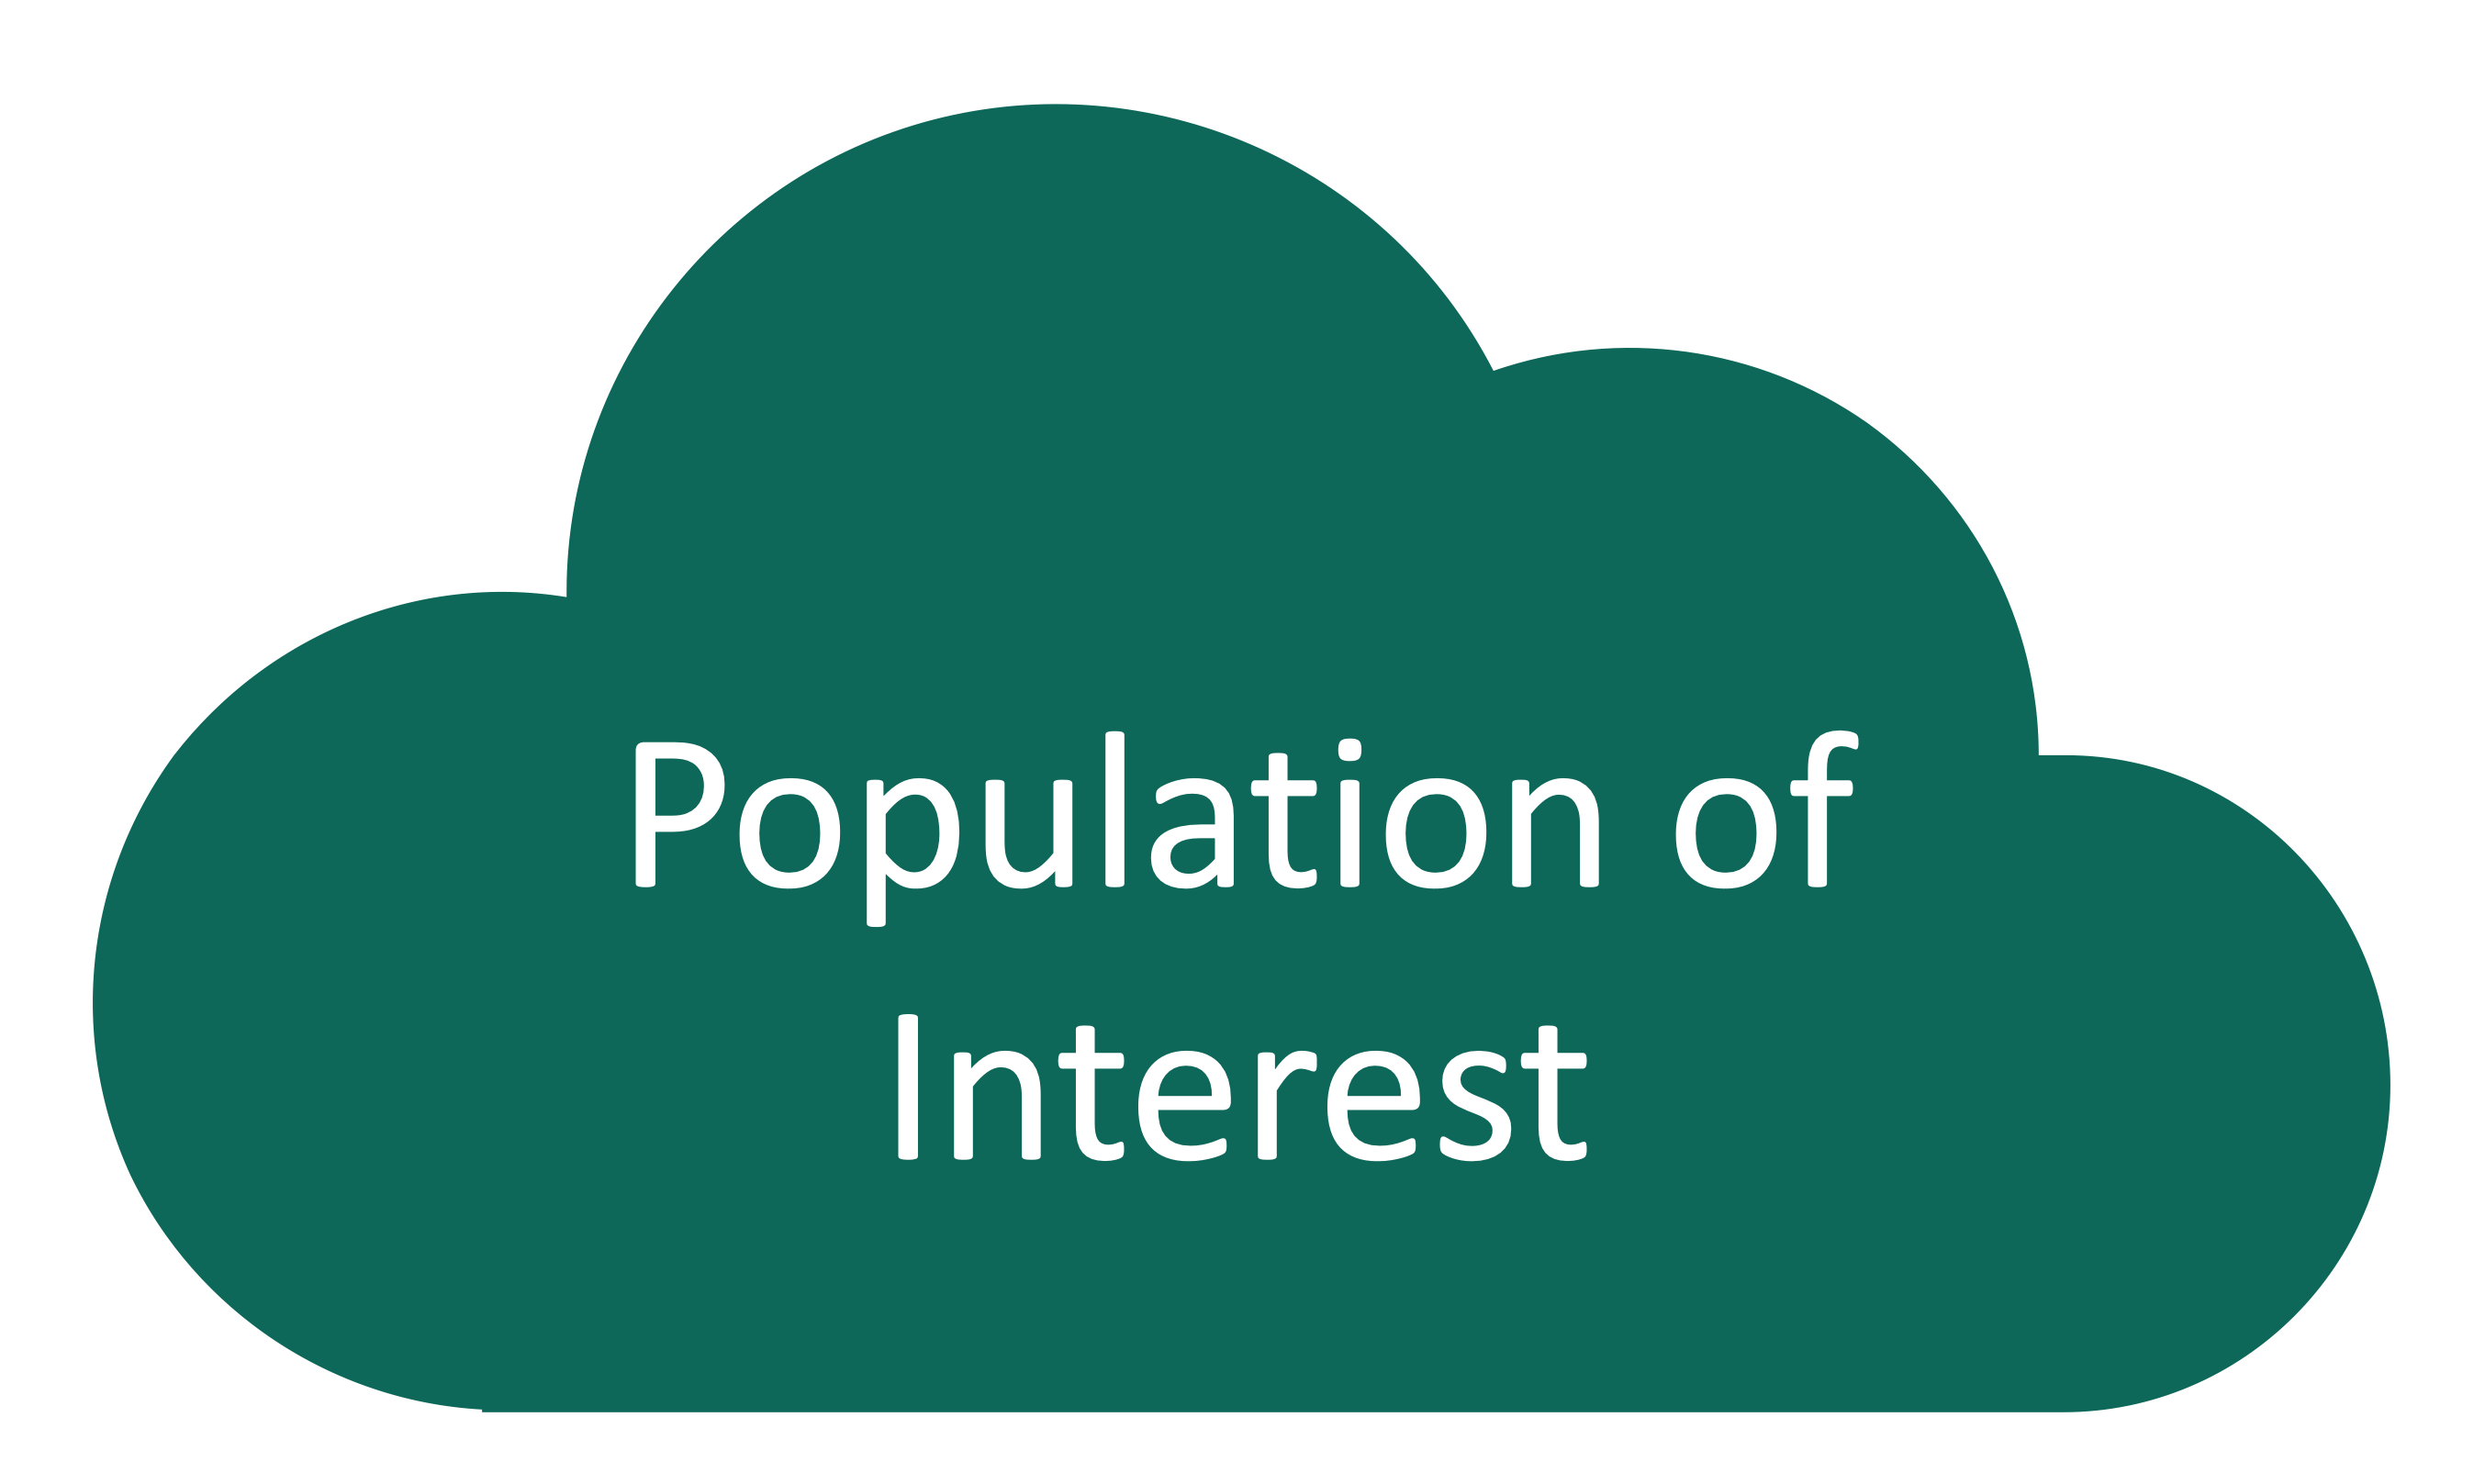
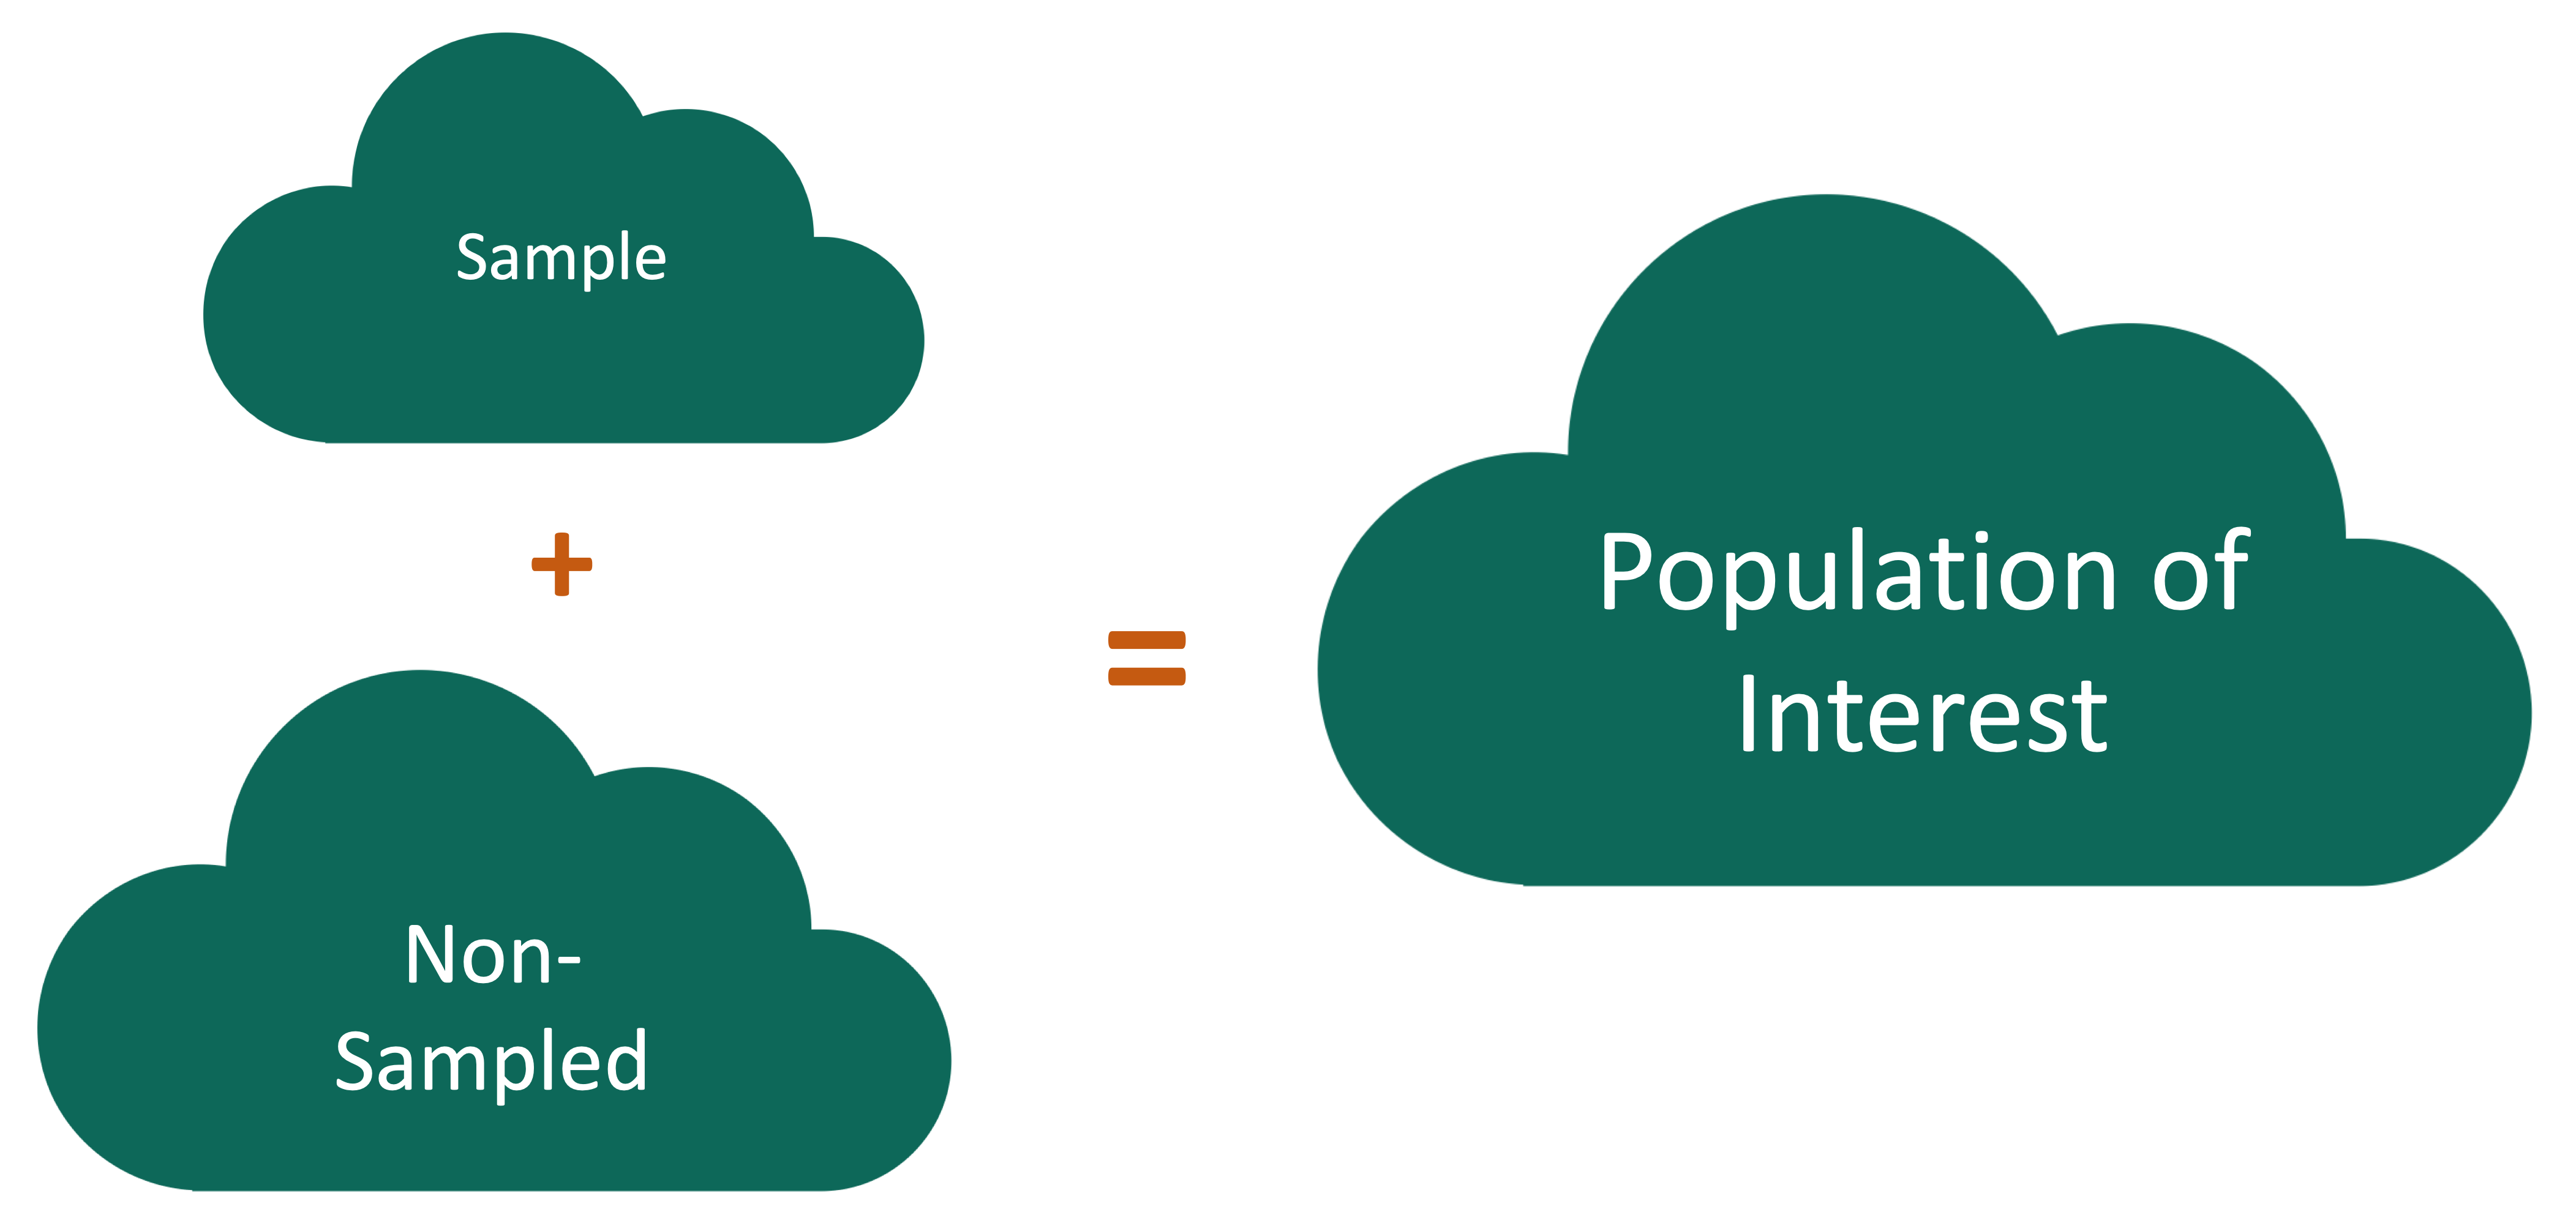
Who are the data supposed to represent?
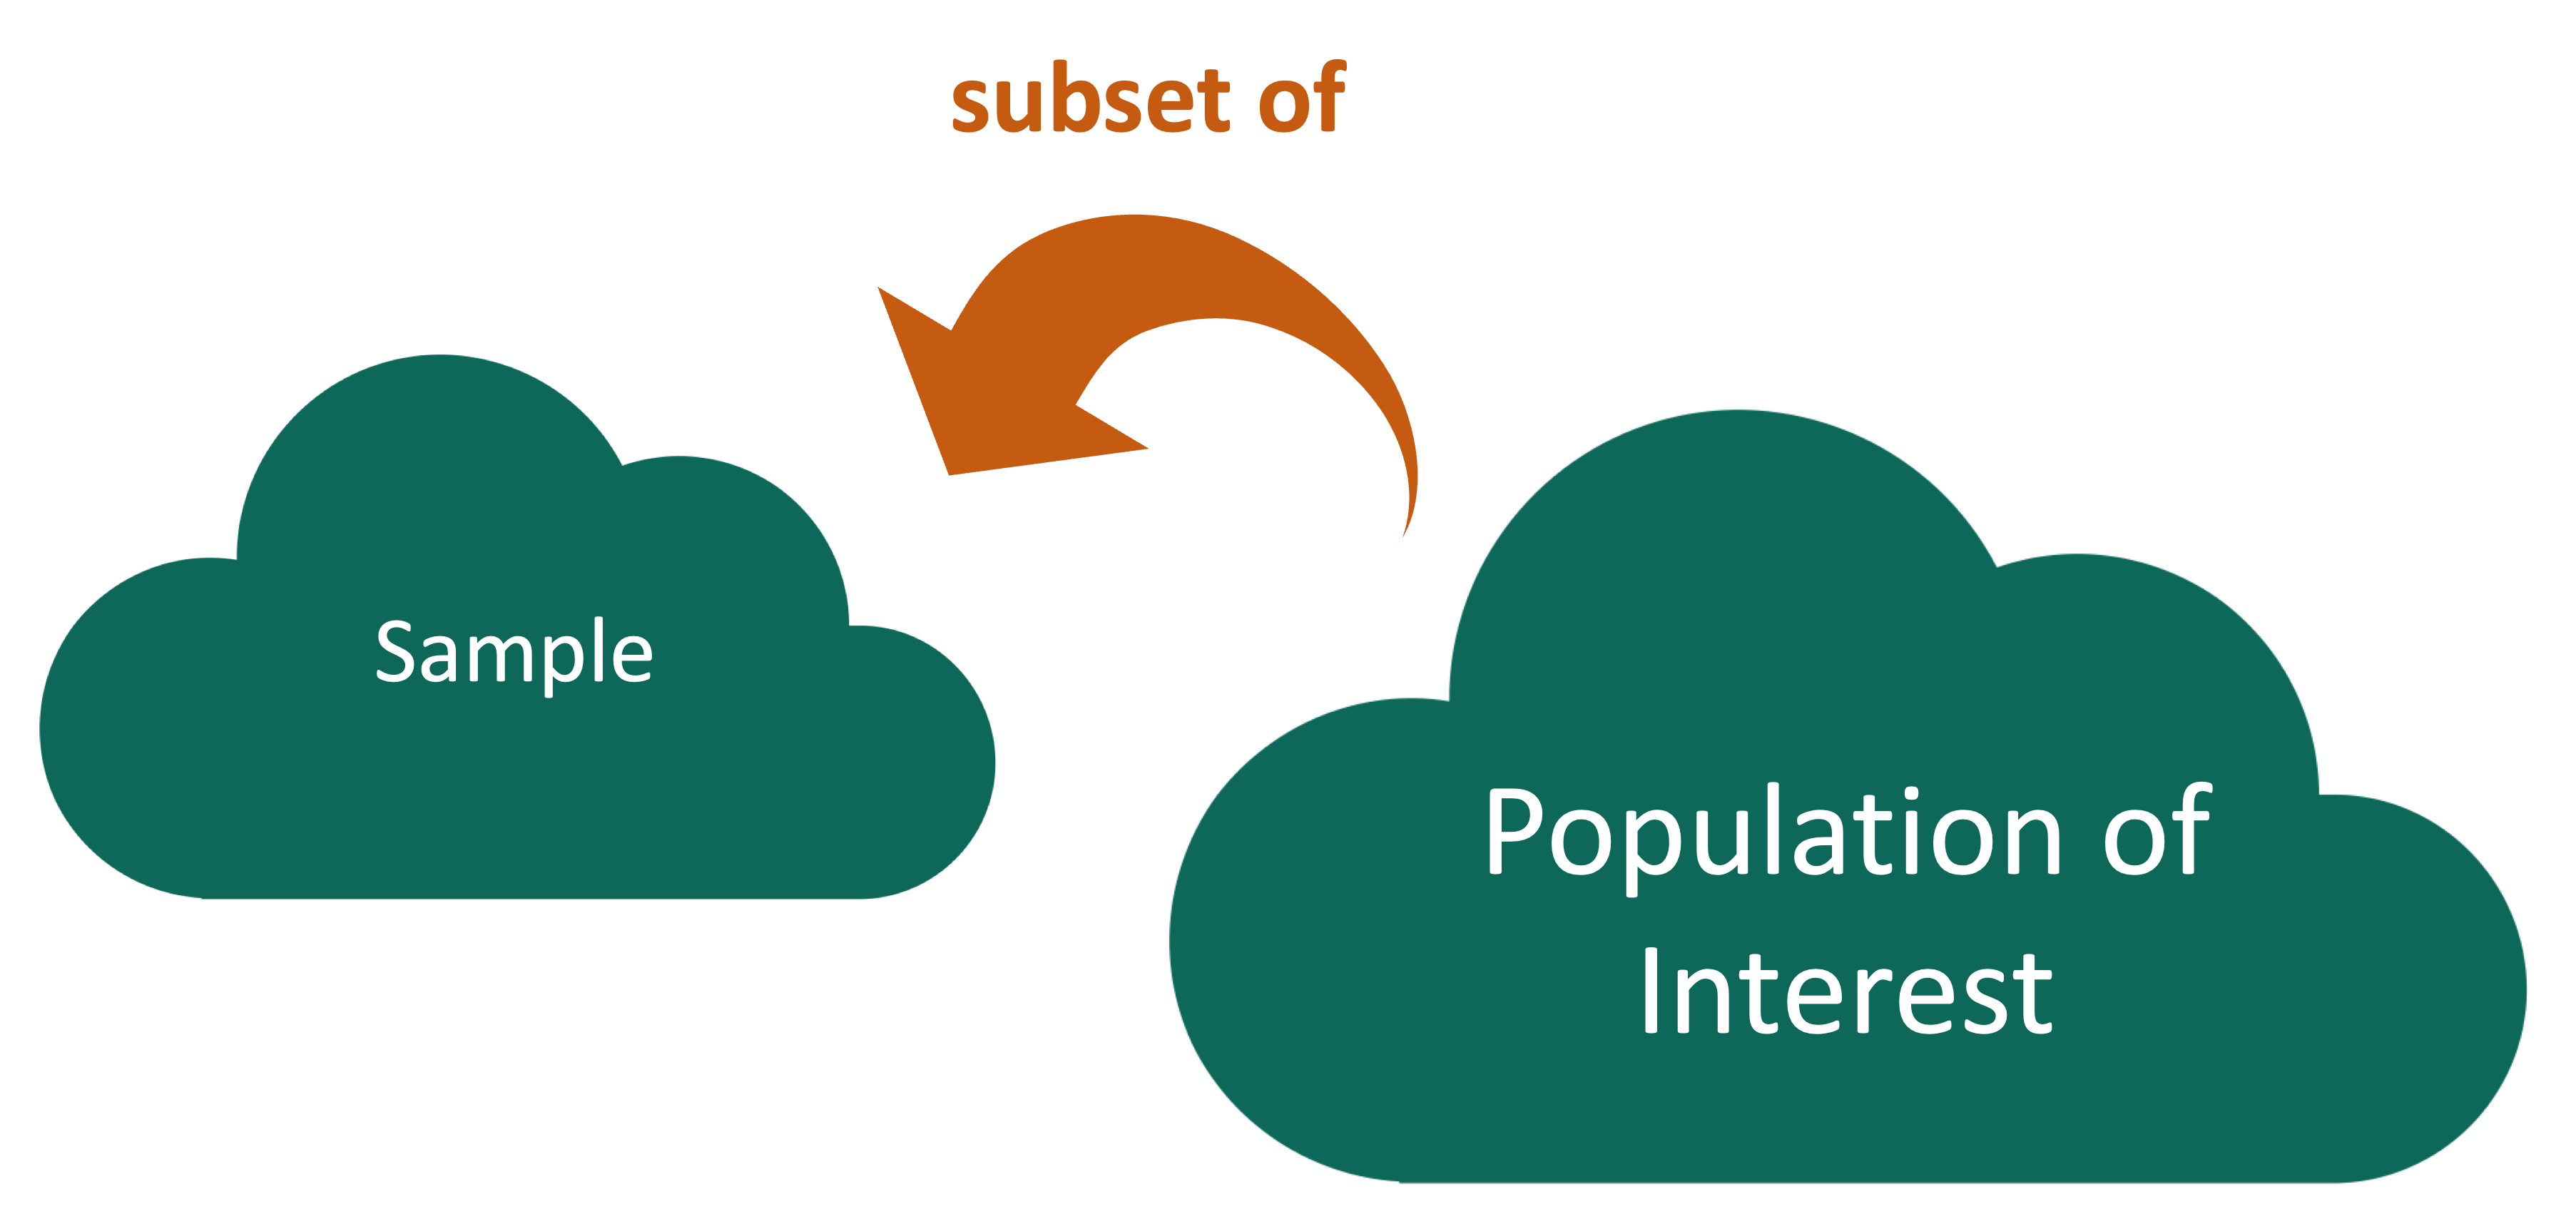
Instead, we use a sample of the population, and use the sample to draw conclusions about the population.
Who are the data supposed to represent?
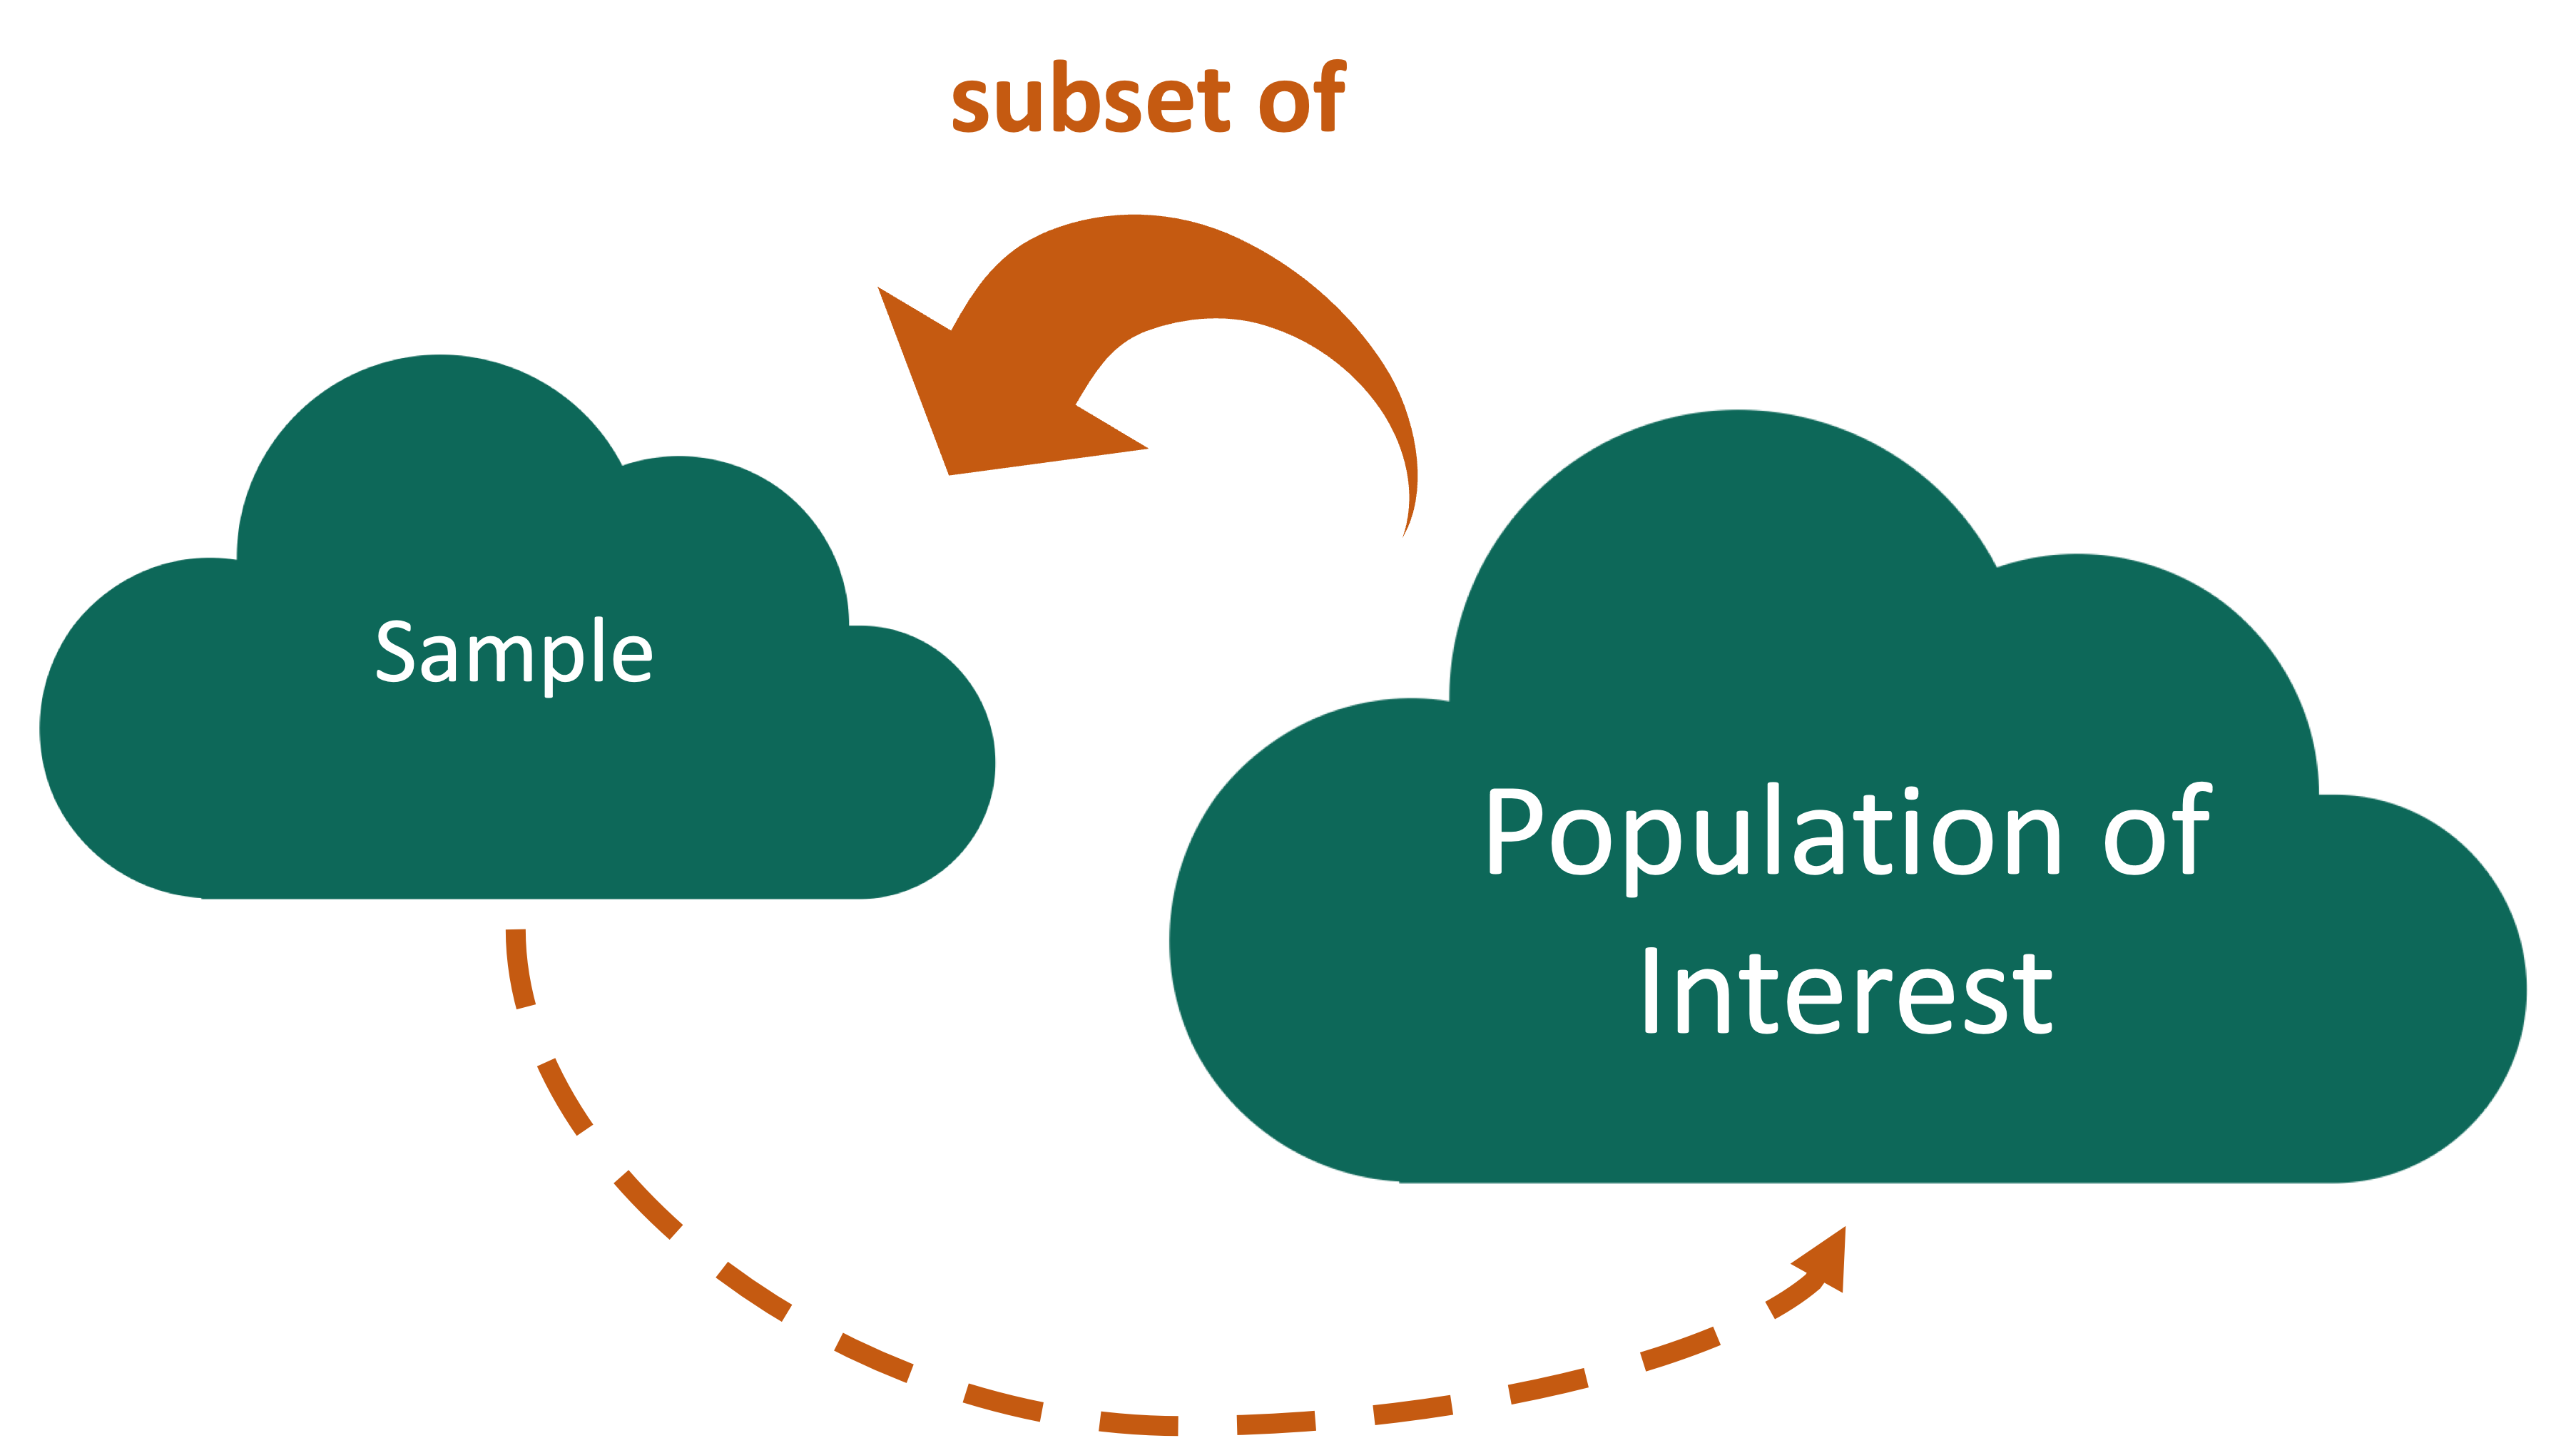
Key questions:
- What evidence is there that the sample is representative of the population?
- Who is present? Who is absent?
- Who is overrepresented? Who is underrepresented?
Sampling Bias
Sampling bias: When certain individuals are more likely to be sampled than others
Sampling Bias
Sampling bias: When certain individuals are more likely to be sampled than others
Q: Consider a telephone poll for an election - where might we get sampling bias?
- Non-response: individual can’t or won’t contribute
- Undercoverage: some groups are less likely to be called
- Inaccurate response
- Self-selection: membership in the sample is voluntary
- Convenience: selecting a convenient but non-representative block to sample
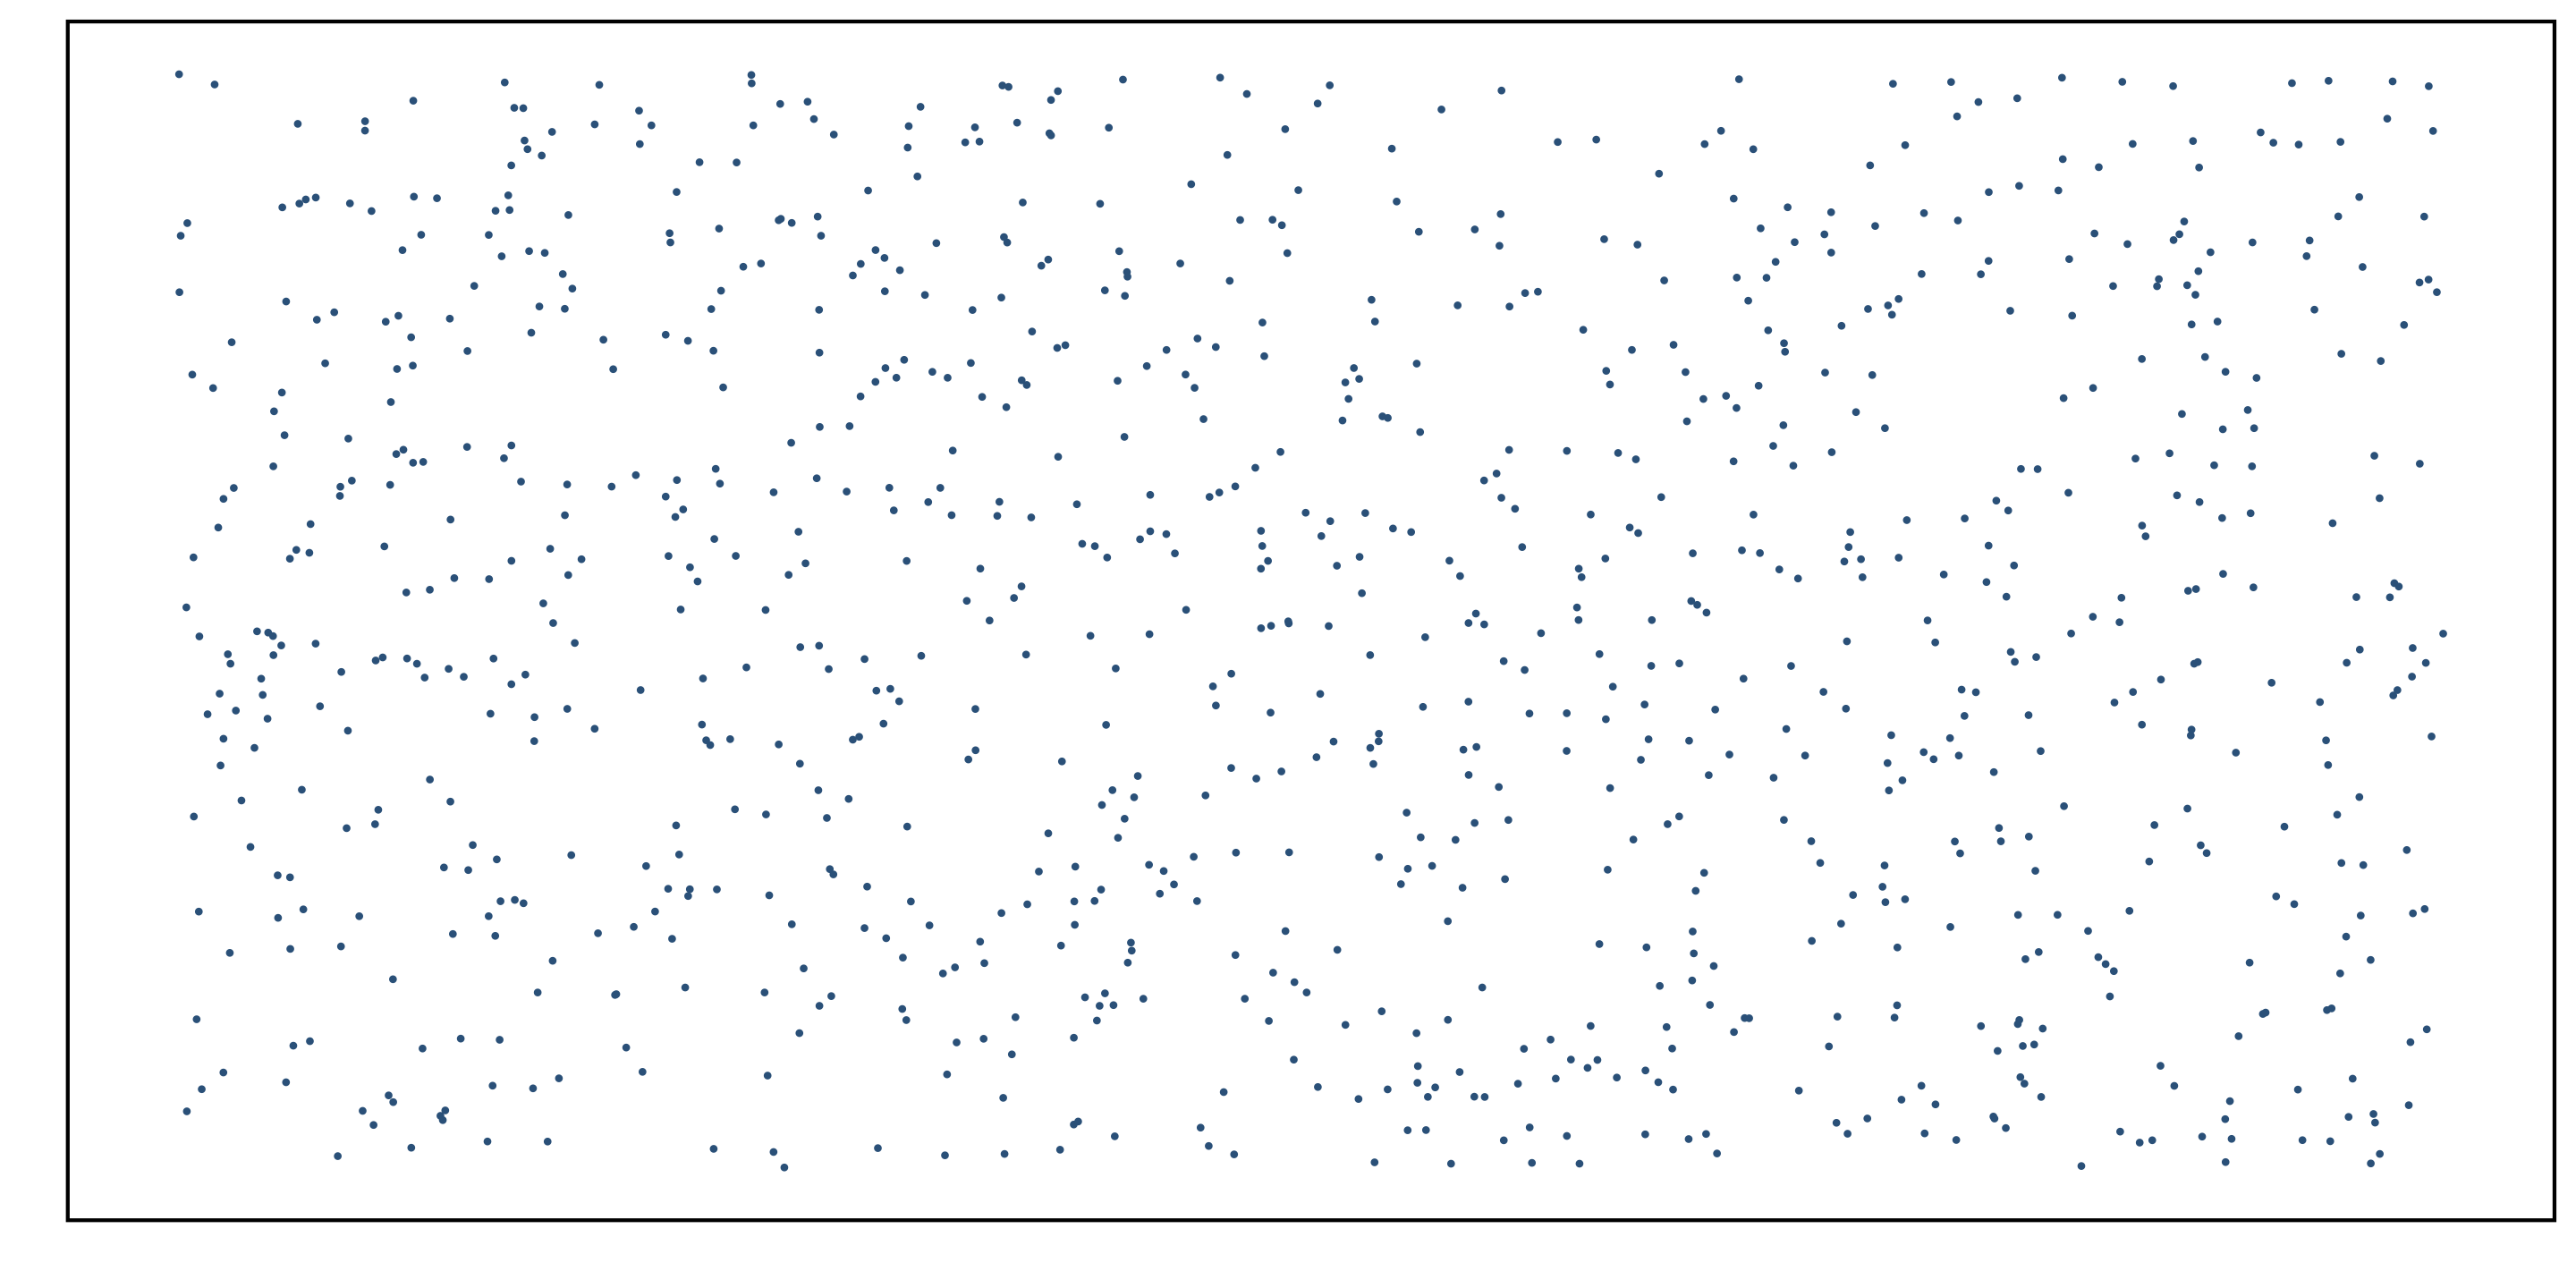
Simple Random Sampling
Motivating question: what is the average amount of student loan debt in Oregon?
Simple Random Sampling: Imagine that a unique ID for each student in the population is written on a slip of paper…
- Shuffle the slips of paper in a bowl
- Draw \(n\) IDs/slips one-by-one to create a sample
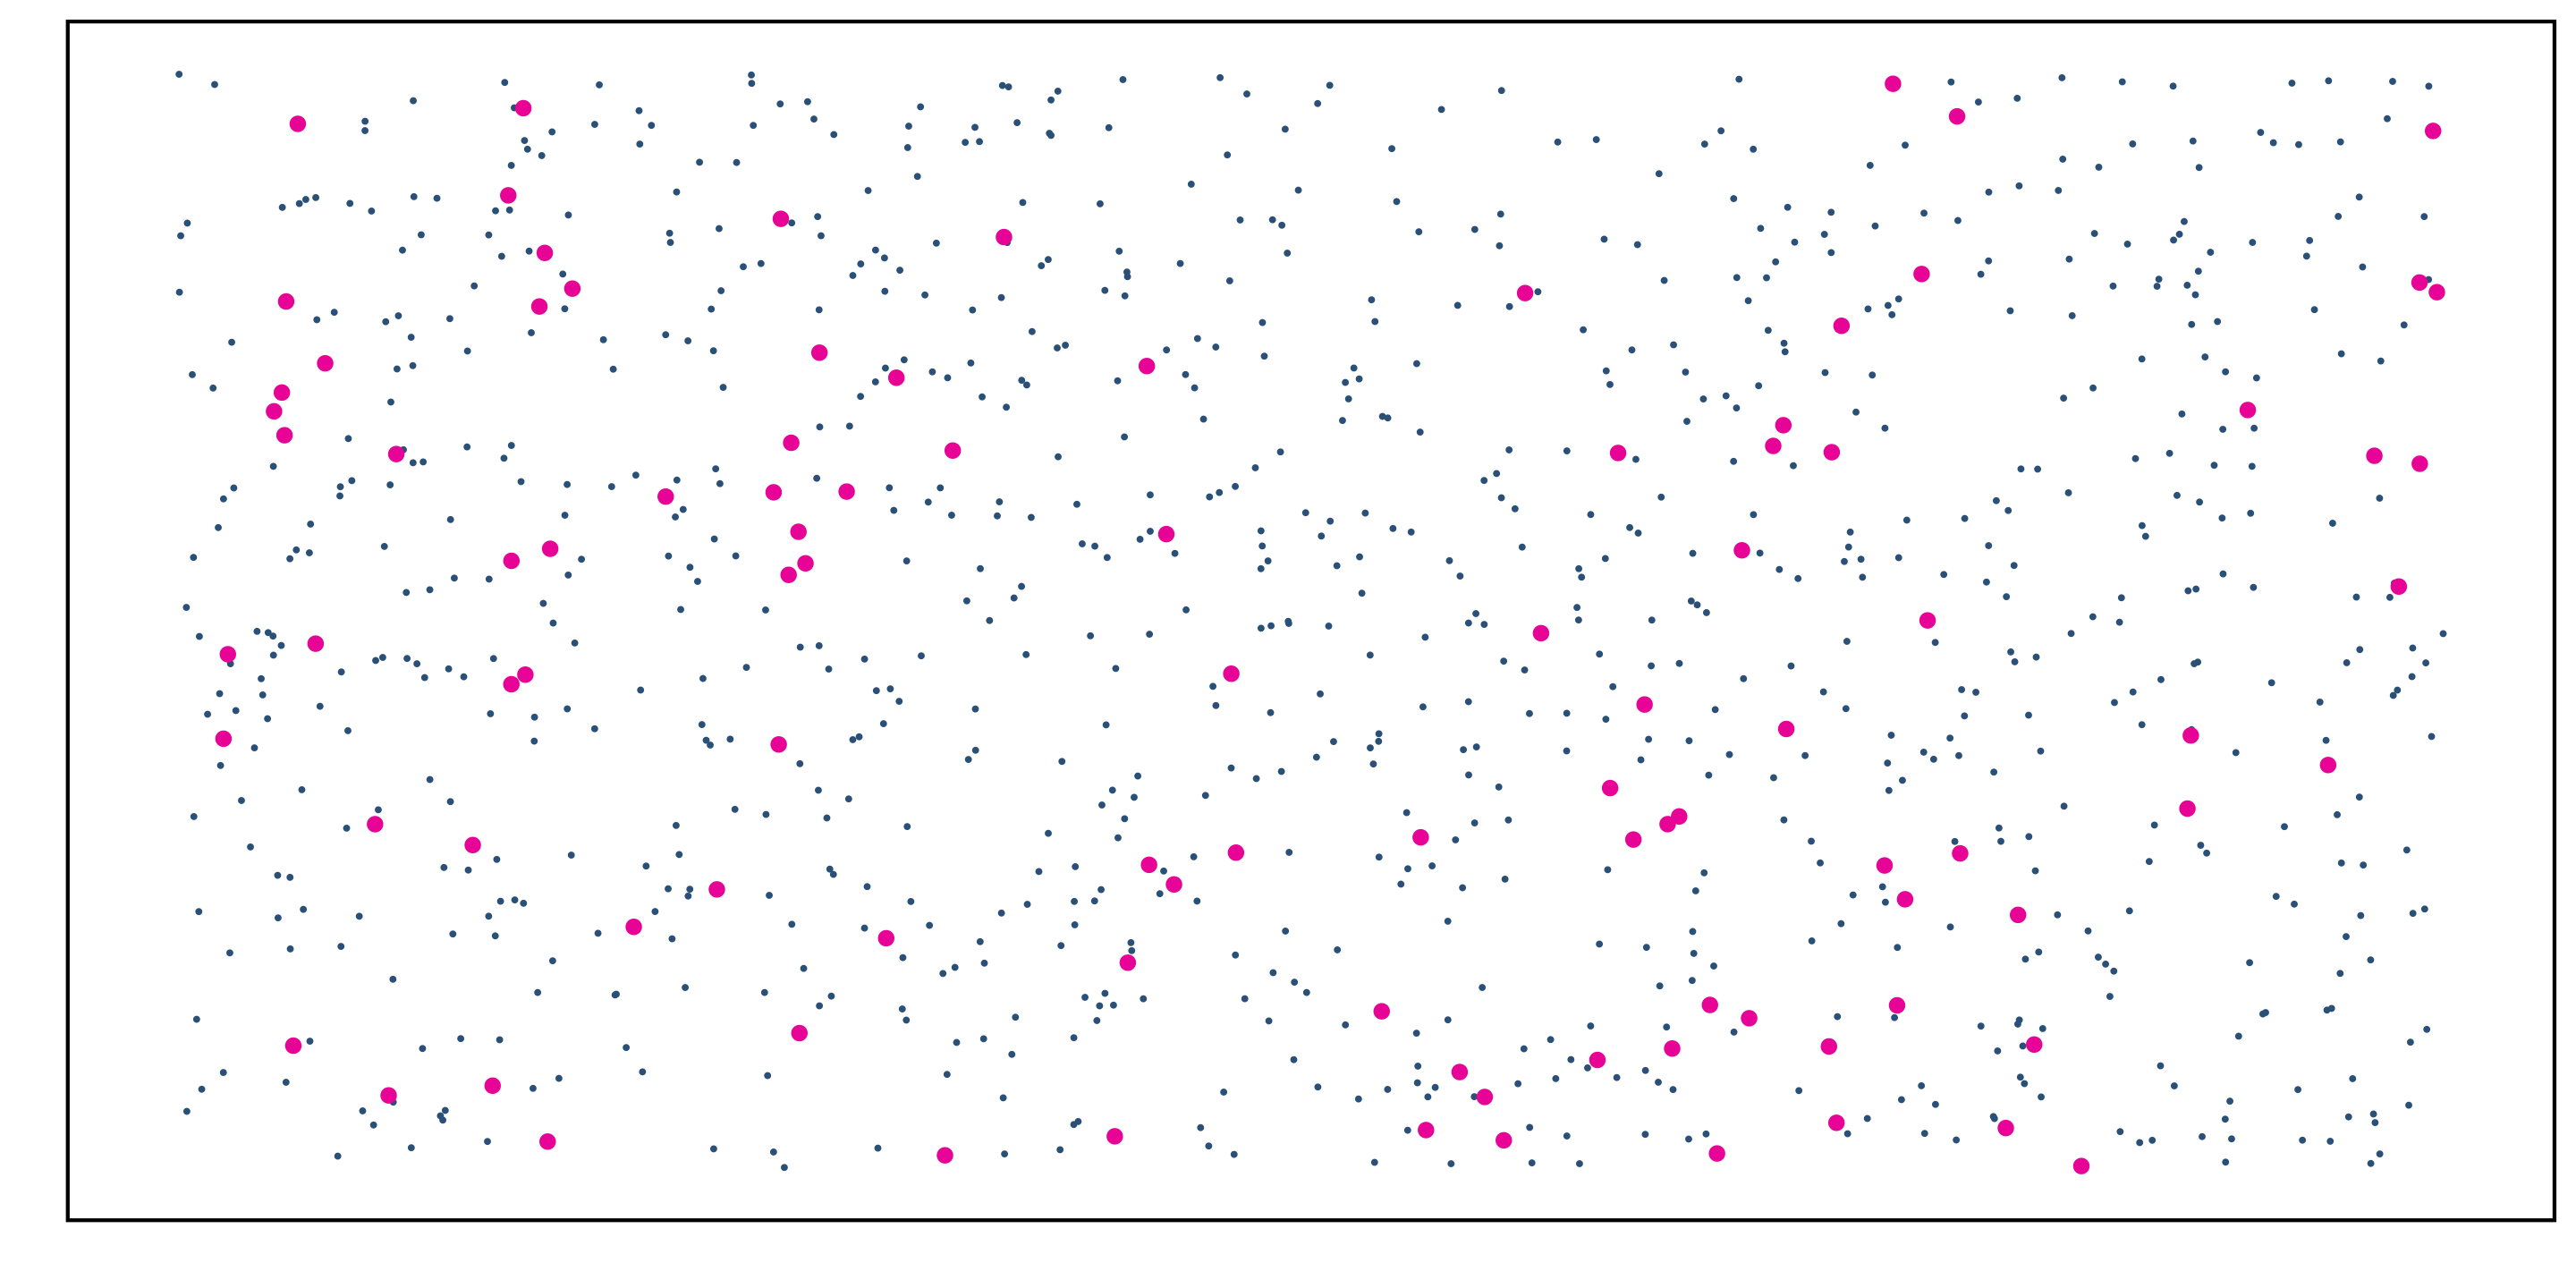
Simple Random Sampling
Consequences:
- Every member of the population has an equal chance of being selected for the sample
- There is no inherent correlation between any two members of the sample
Q: Can a simple random sample be non-representative?
A: Yes, even if all goes as planned!
- For large sample sizes, it’s unlikely
- The sample will be representative on average
Q: Why aren’t all samples generated using simple random sampling?

Simple Random Sampling
Advantages:
- Relatively simple to interpret and analyze
- Non-biased (in theory)
Disadvantages:
- May not be as “precise” as other sampling techniques
- Can be difficult to perform in practice

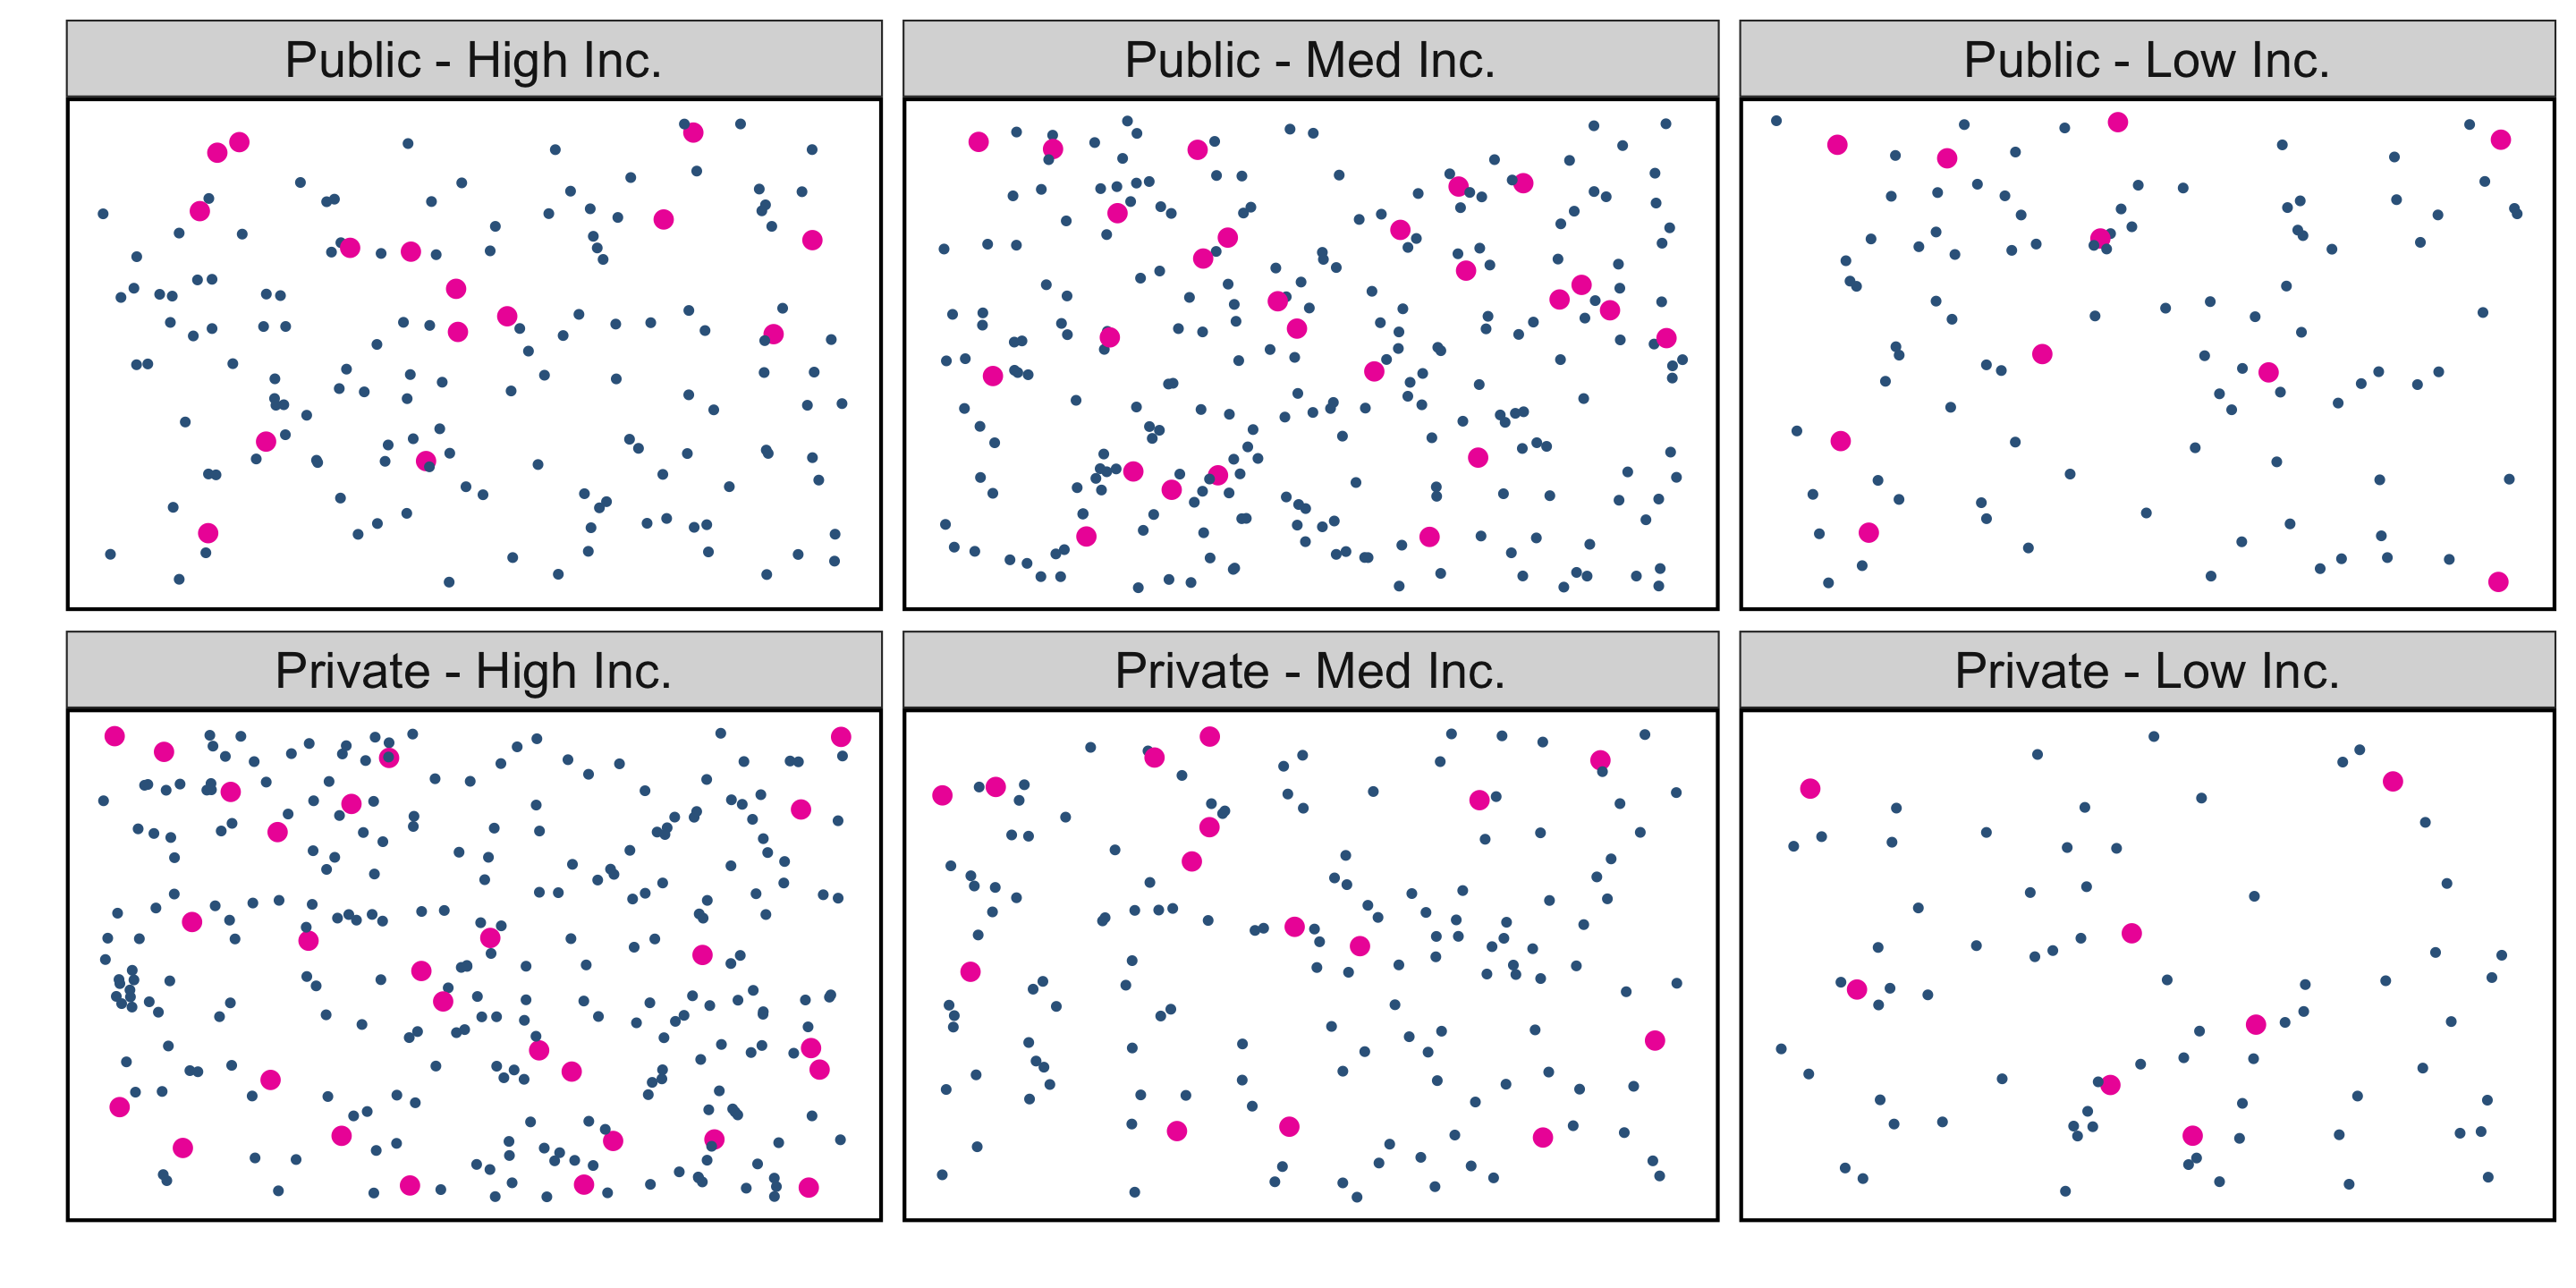
Stratified Random Sampling
Motivating question: what is the average amount of student loan debt in Oregon?
Stratified Random Sampling: “Strata” are made up of similar individuals, then simple random samples are taken from each stratum.
- e.g. define strata based on public vs private college and family income ranges
Stratified Random Sampling
Stratified Random Sampling: “Strata” are made up of similar individuals, then simple random samples are taken from each stratum.
Advantages:
- Can be more “precise” than simple random sampling, requiring lower sample size
- Hedges against non-representative samples
Disadvantages:
- Statistical analysis is more complex
- Strata creation isn’t always straightforward (need additional data, and to have compelling reasons for strata definitions)

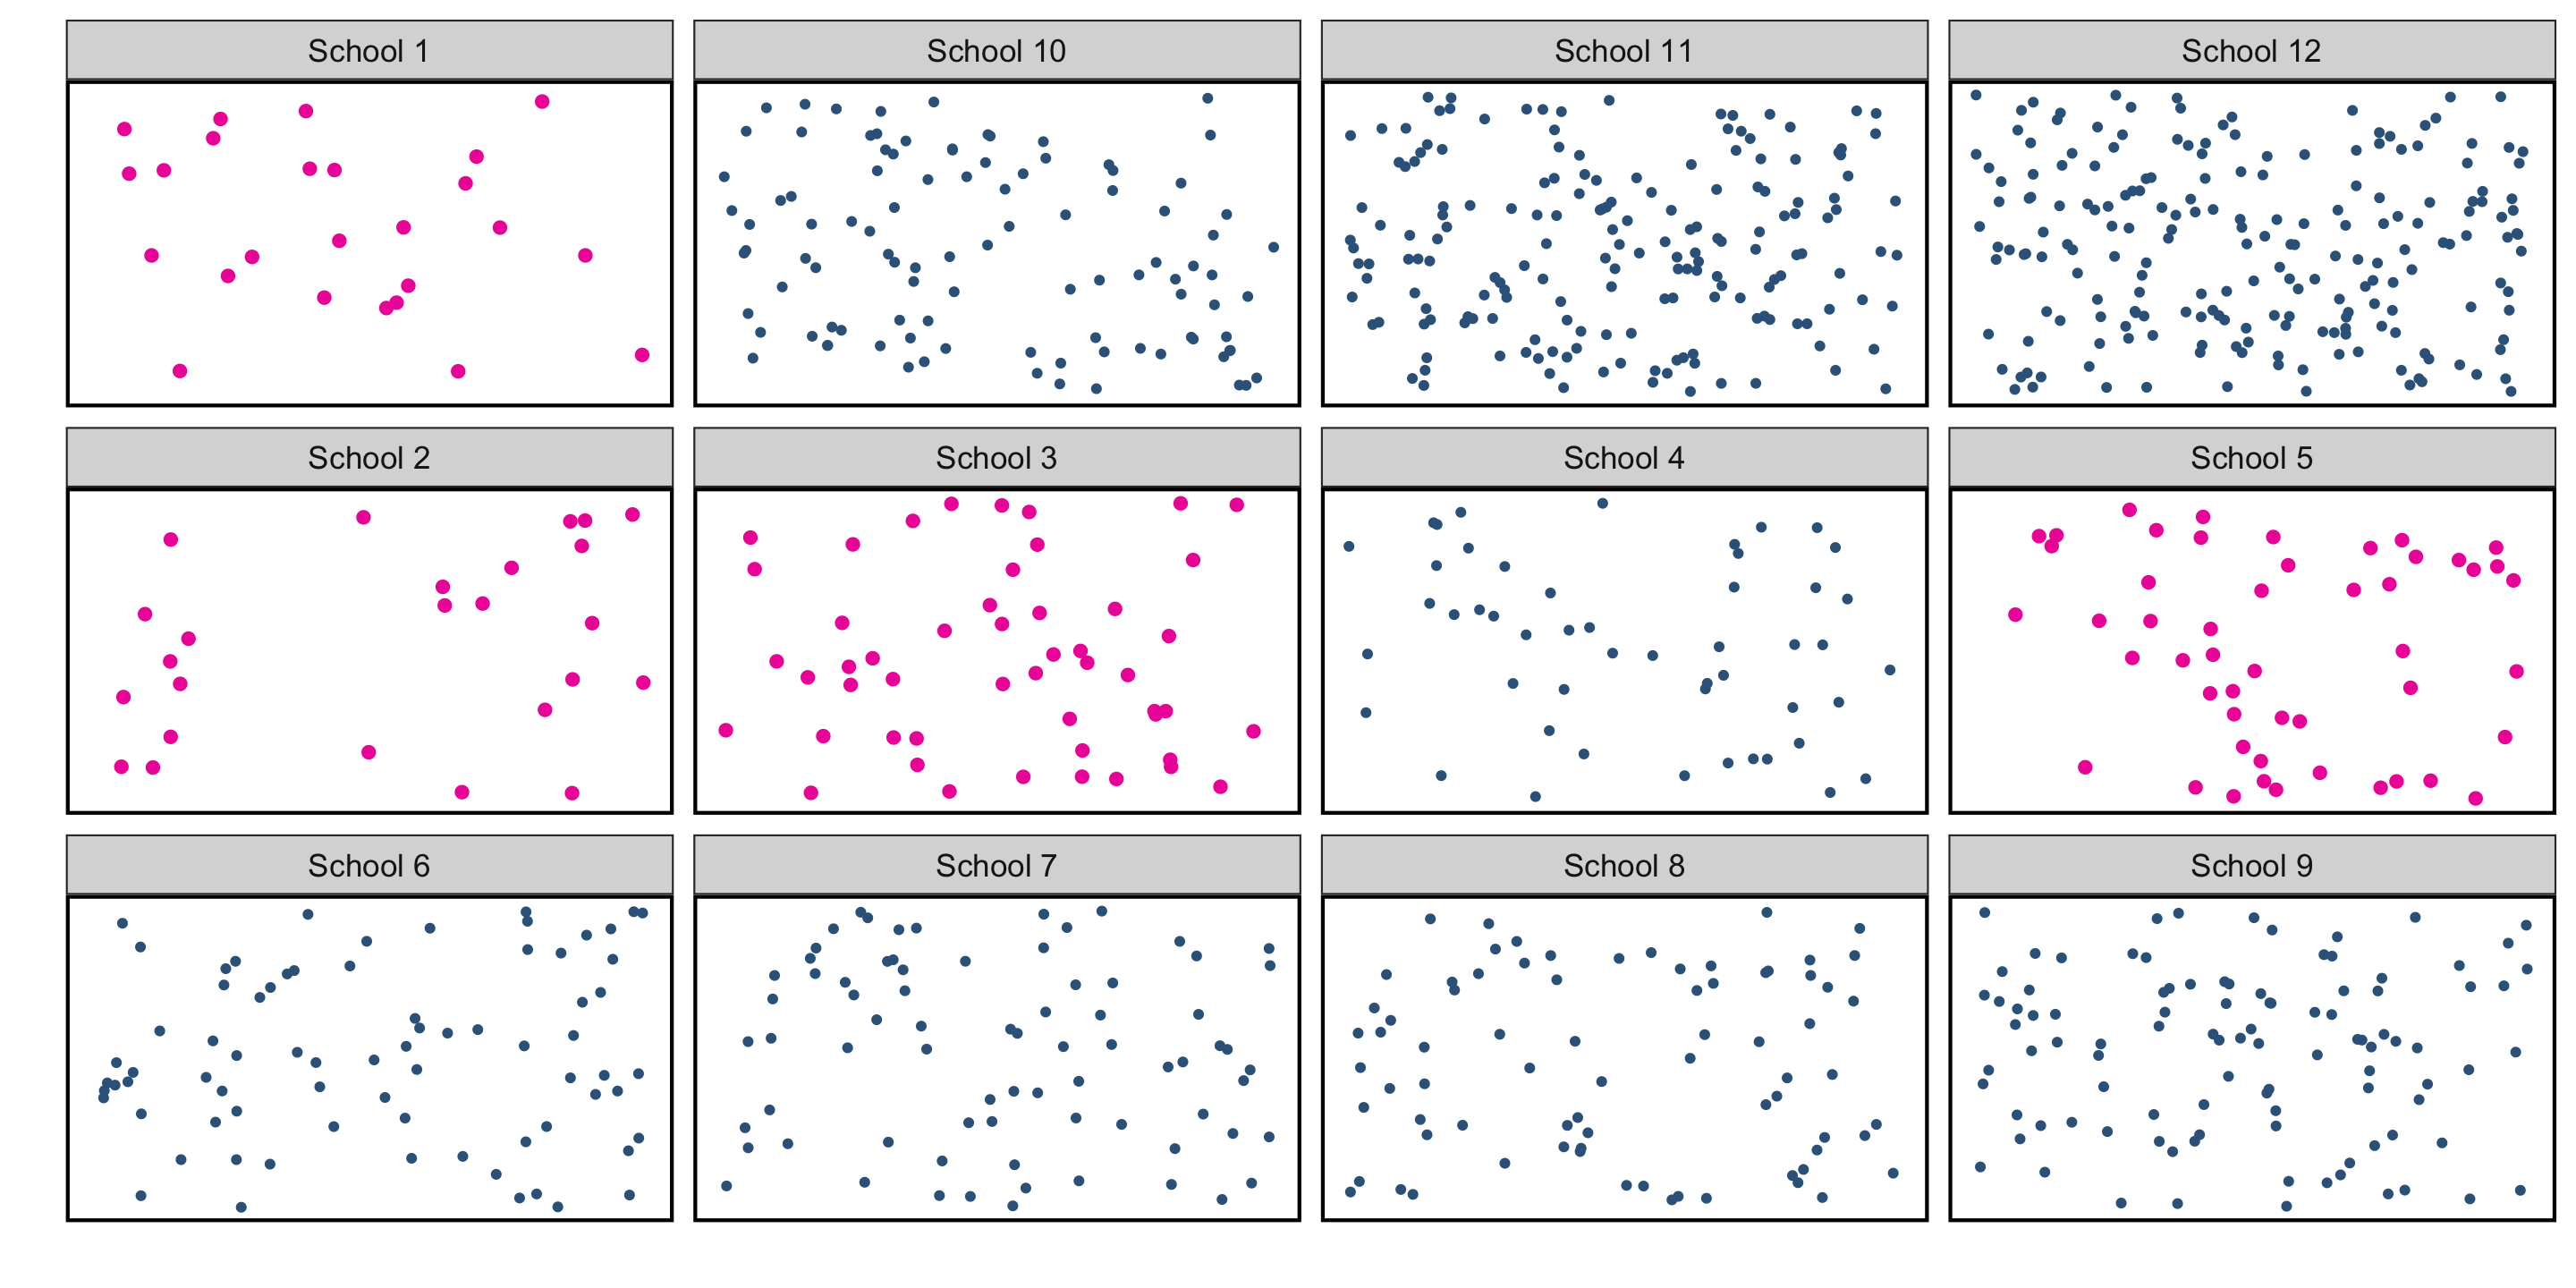
Cluster Random Sampling
Motivating question: what is the average amount of student loan debt in Oregon?
Cluster Random Sampling: “Clusters” are non-homogeneous. We take a simple random sample of the clusters, and use all observations in those clusters as the sample.
- e.g. we take a simple random sample of schools, include all students in those schools in the sample

Cluster Random Sampling
Cluster Random Sampling: “Clusters” are non-homogeneous. We take a simple random sample of the clusters, and use all observations in those clusters as the sample.
Advantages:
- Useful when it’s difficult/impossible to exhaustively list the population
- Often more time/cost effective per \(n\)
- Useful when population is naturally concentrated in heterogeneous groups
Disadvantages:
- Less precise than simple or stratified sampling
- Statistical analysis is more complicated
- Natural clusters may not always exist
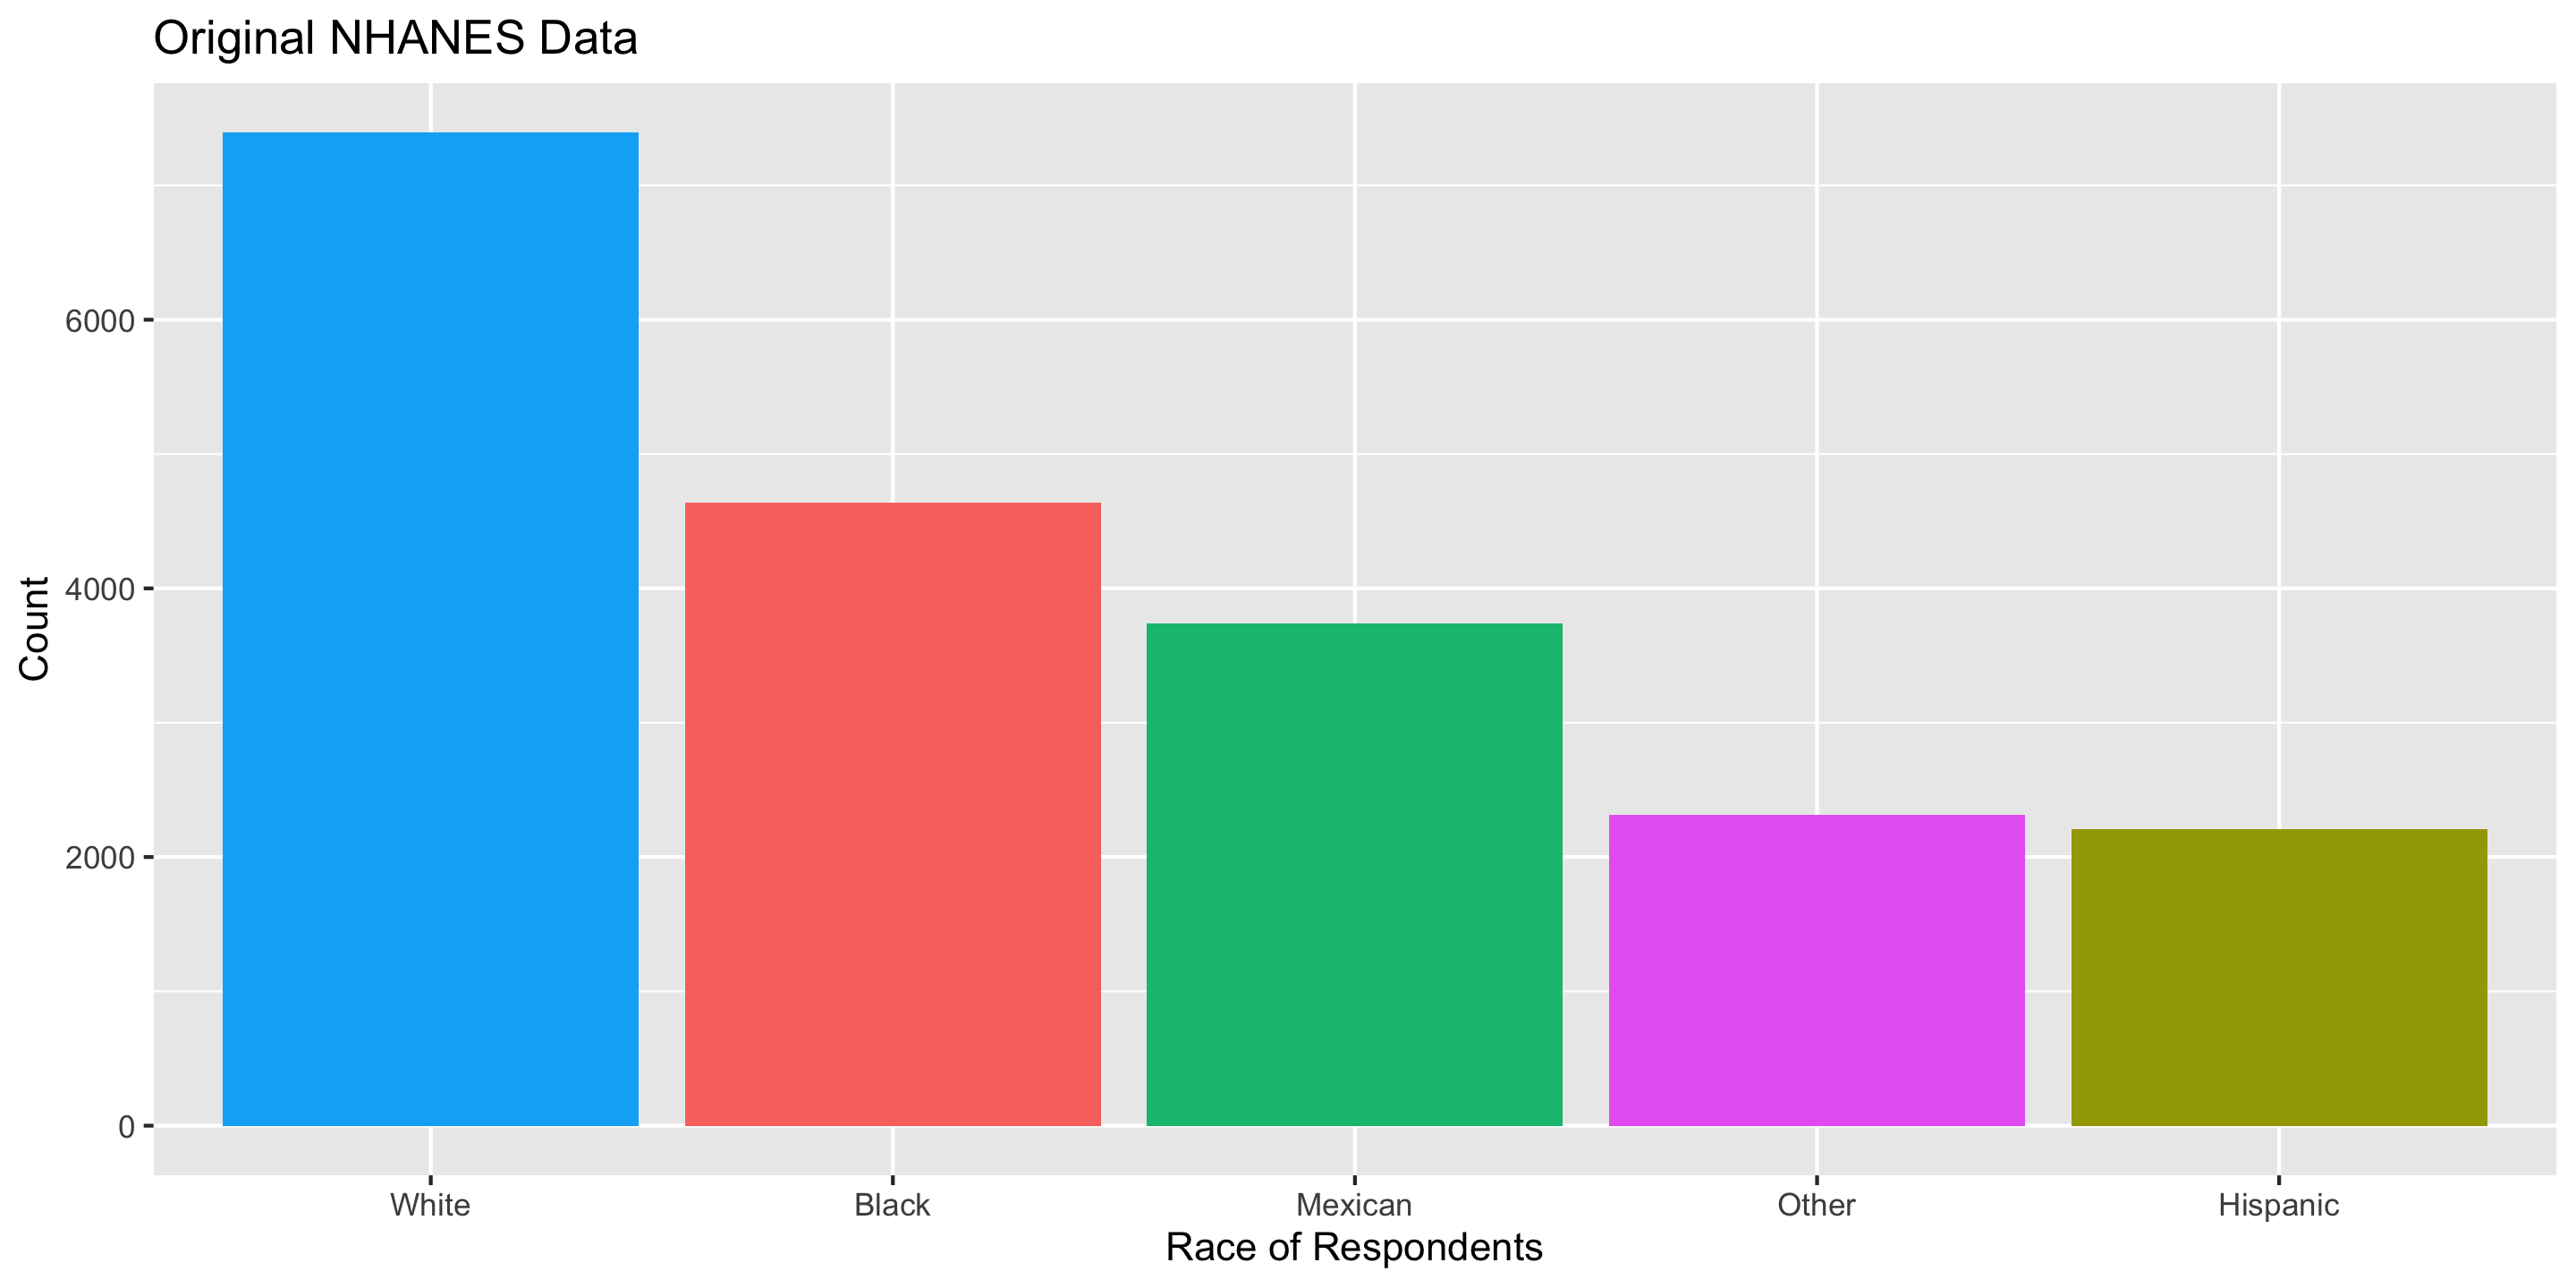
National Health and Nutrition Examination Survey
![]()
Mission: “Assess the health and nutritional status of adults and children in the United States.”
How are these data collected?
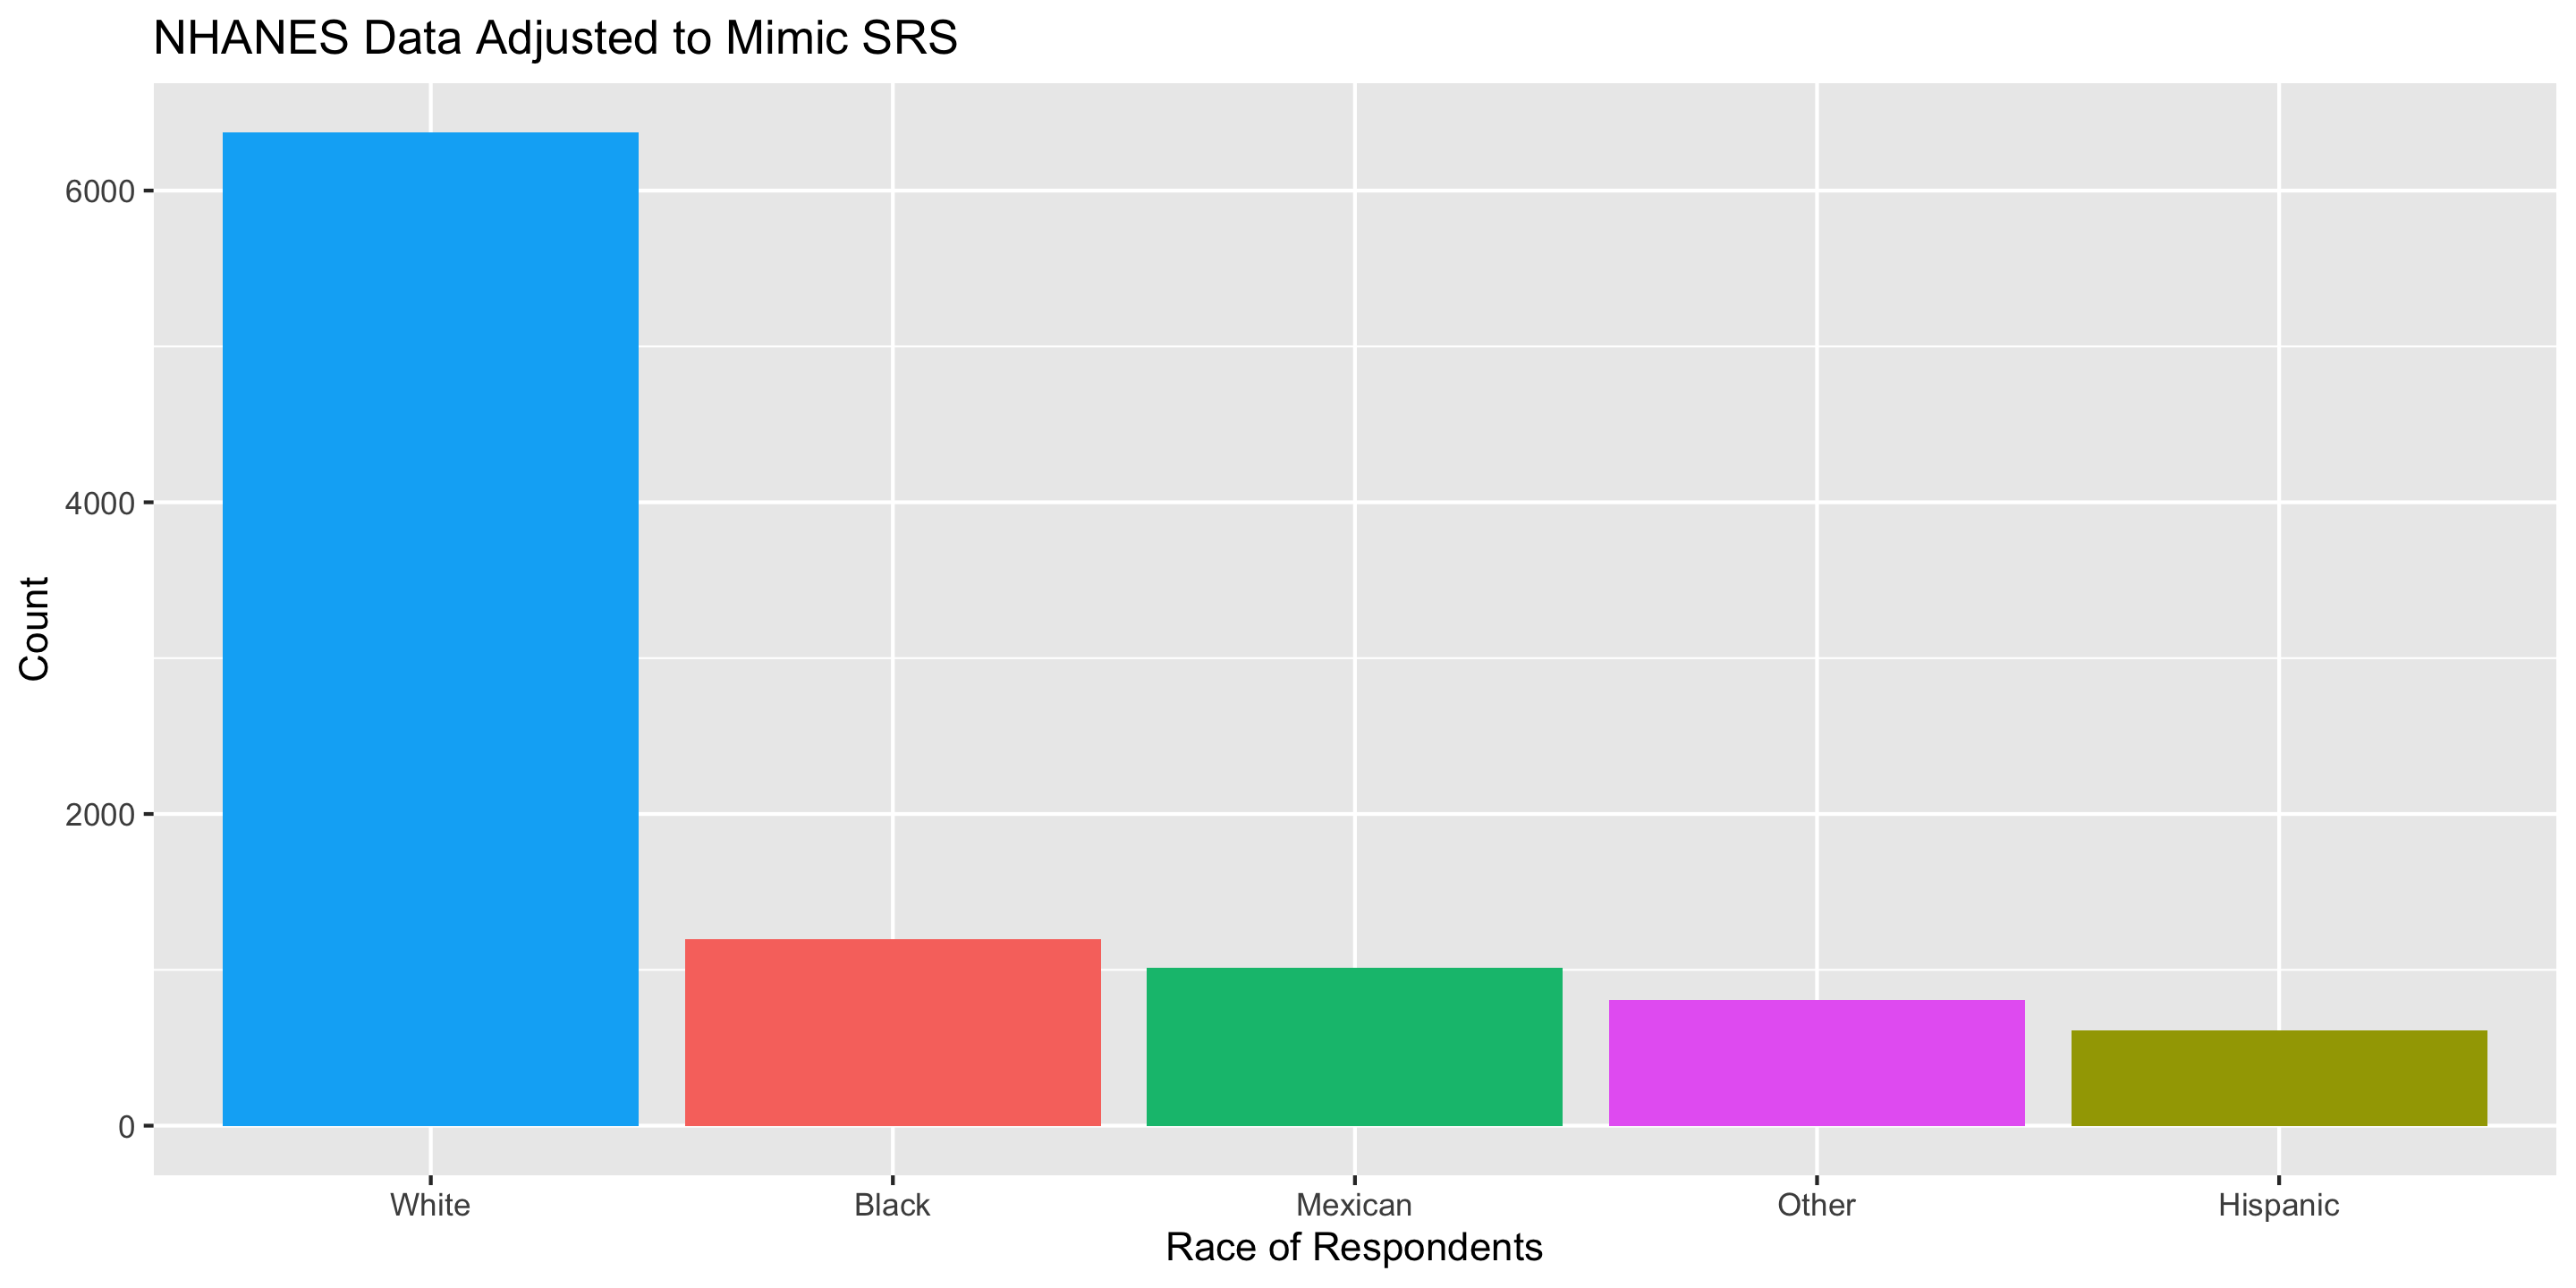
Careful Using Non-Simple Random Sample Data
Responsibilities to Research Subjects
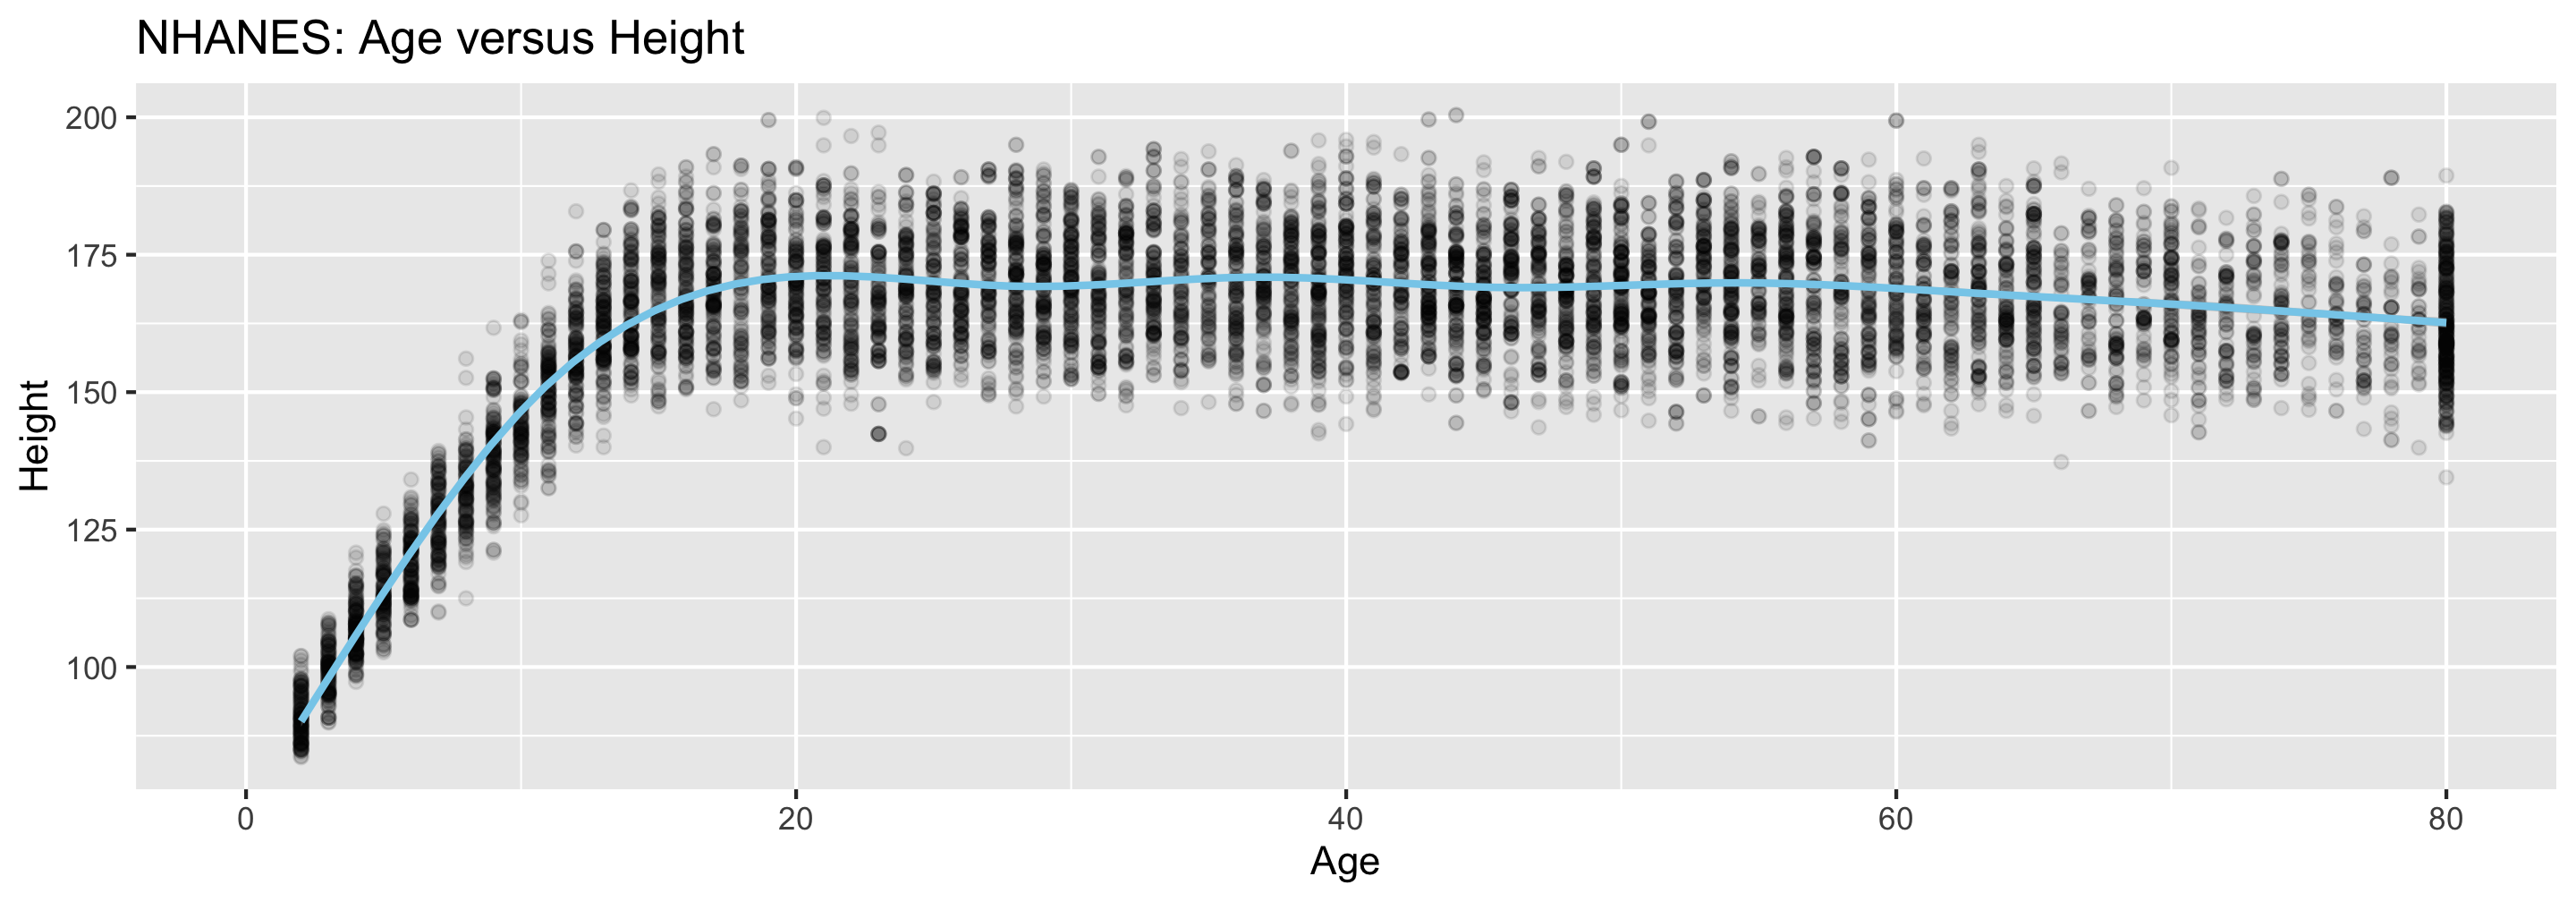
Why do you think the Age variable maxes out at 80?
“Protects the privacy and confidentiality of research subjects and data concerning them, whether obtained from the subjects directly, other persons, or existing records.”